.webp)
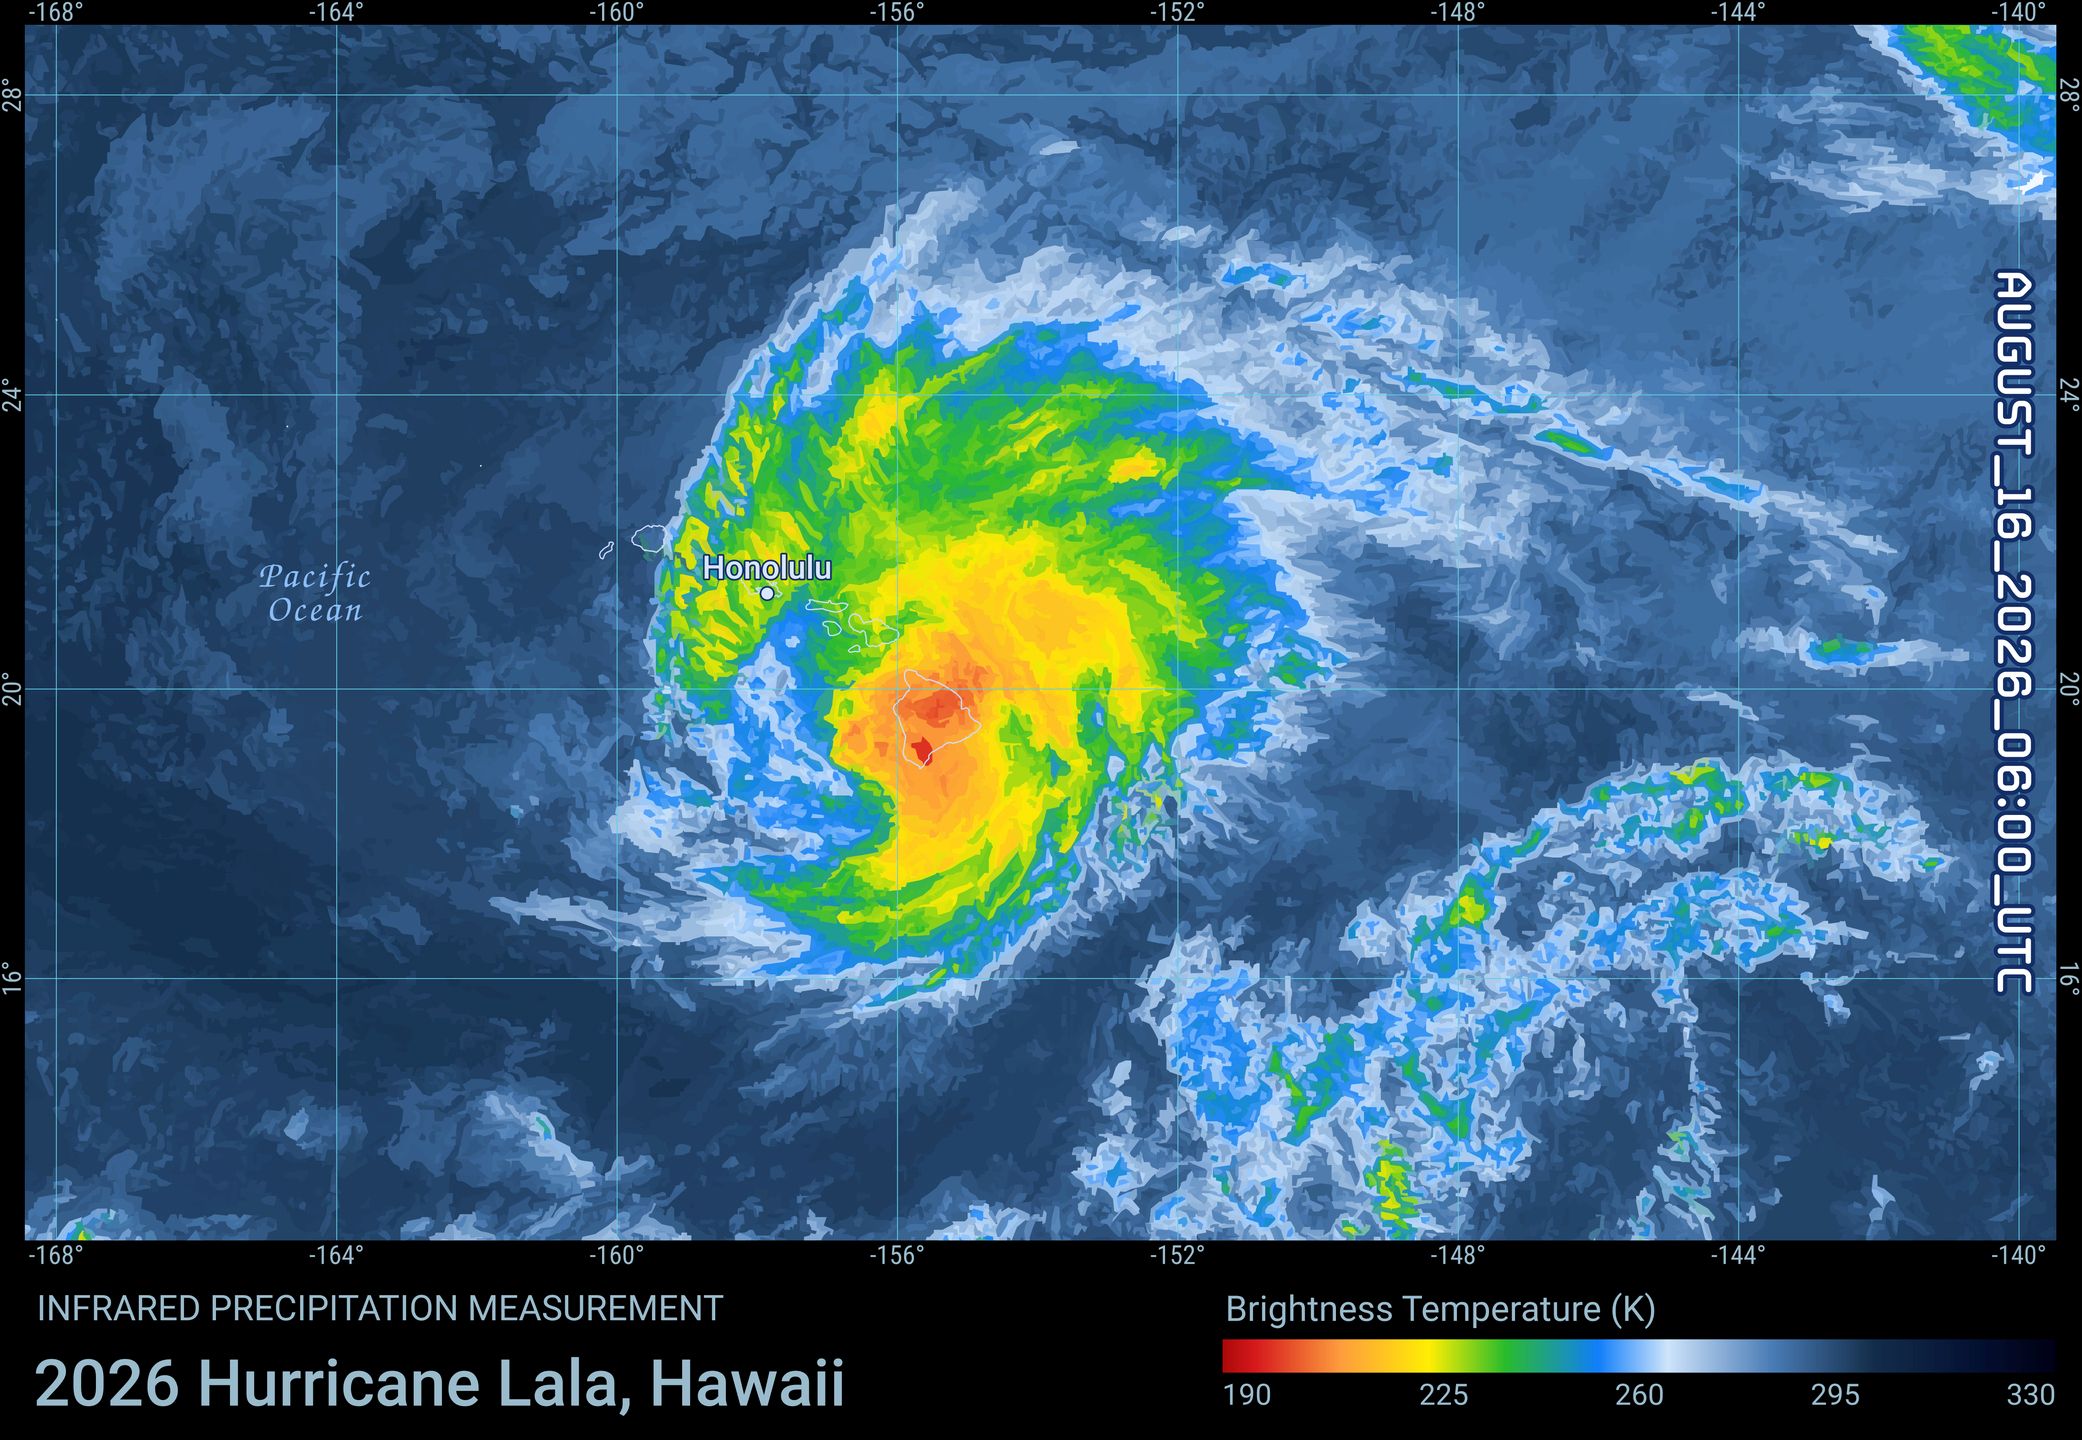
On August 16 2026, Hurricane Lala’s center passed less than 30 miles off of the coast of the Big Island of Hawaiʻi. Lala narrowly avoided becoming the sixth tropical cyclone to make landfall in the Hawaiʻian Islands. On the Big Island’s eastern shore, hurricane winds and steep terrain combined to bring over 36 inches of rain to some areas, with Laupāhoehoe Natural Area Reserve unofficially receiving a whopping 44 inches of rain. While fierce winds and snowfall lashed the summit of Mauna Kea, the Big Island’s rugged terrain helped shield the western side of the island, which received much less rain.
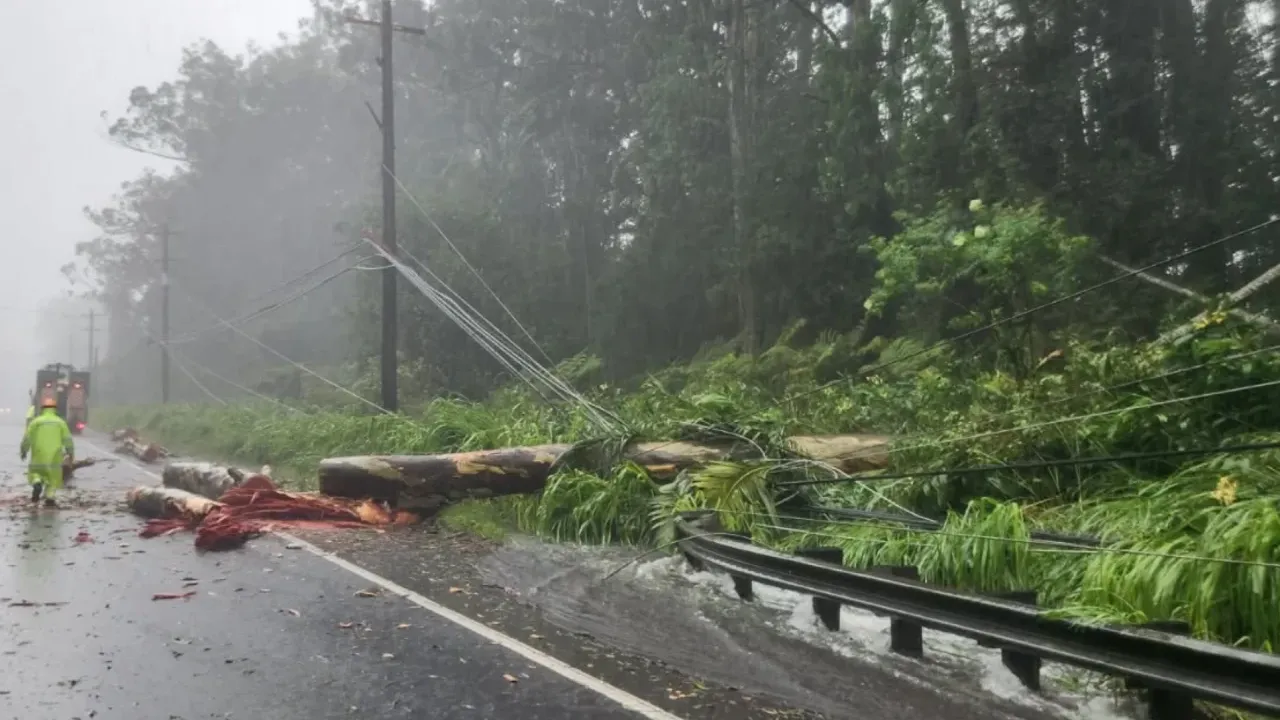
As a result of Hurricane Lala, at least 2 people have died, nearly 200,000 residents of Hawaiʻi lost power, and rural areas could be without power for weeks, as has been the case after previous tropical cyclones like Iselle. At least 100 homes and 8 bridges have been destroyed by floodwaters. Hawaiʻi’s state legislature has already designated at least $100 million for storm recovery, and has requested millions more. Hawaiʻi will also receive a coral reef insurance payout of at least $200,000 to repair damages caused by Hurricane Lala.
Extreme Rainfall During Hurricane Lala
Jupiter scientists analyzed meteorological data from 120 different weather stations across the Big Island of Hawaiʻi. These data stations are sourced from four different networks, ranging from the long-running and highly quality-controlled Automated Surface Observing System (ASOS) stations at airports, to the citizen science observations of the Community Collaborative Rain, Hail, and Snow Network (CoCoRaHS).
Hurricane Lala’s Extreme Rains Varied Considerably Across the Big Island’s Rugged Terrain
Rainfall severity for Hurricane Lala varied wildly across the Big Island–but at least 34 stations experienced extreme rainfall that corresponded to a 50-year event or more.
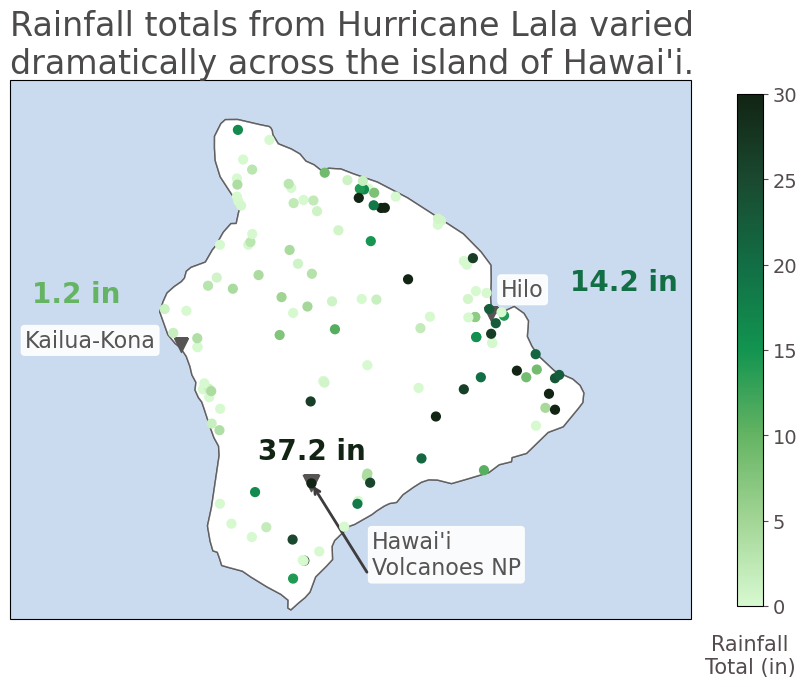
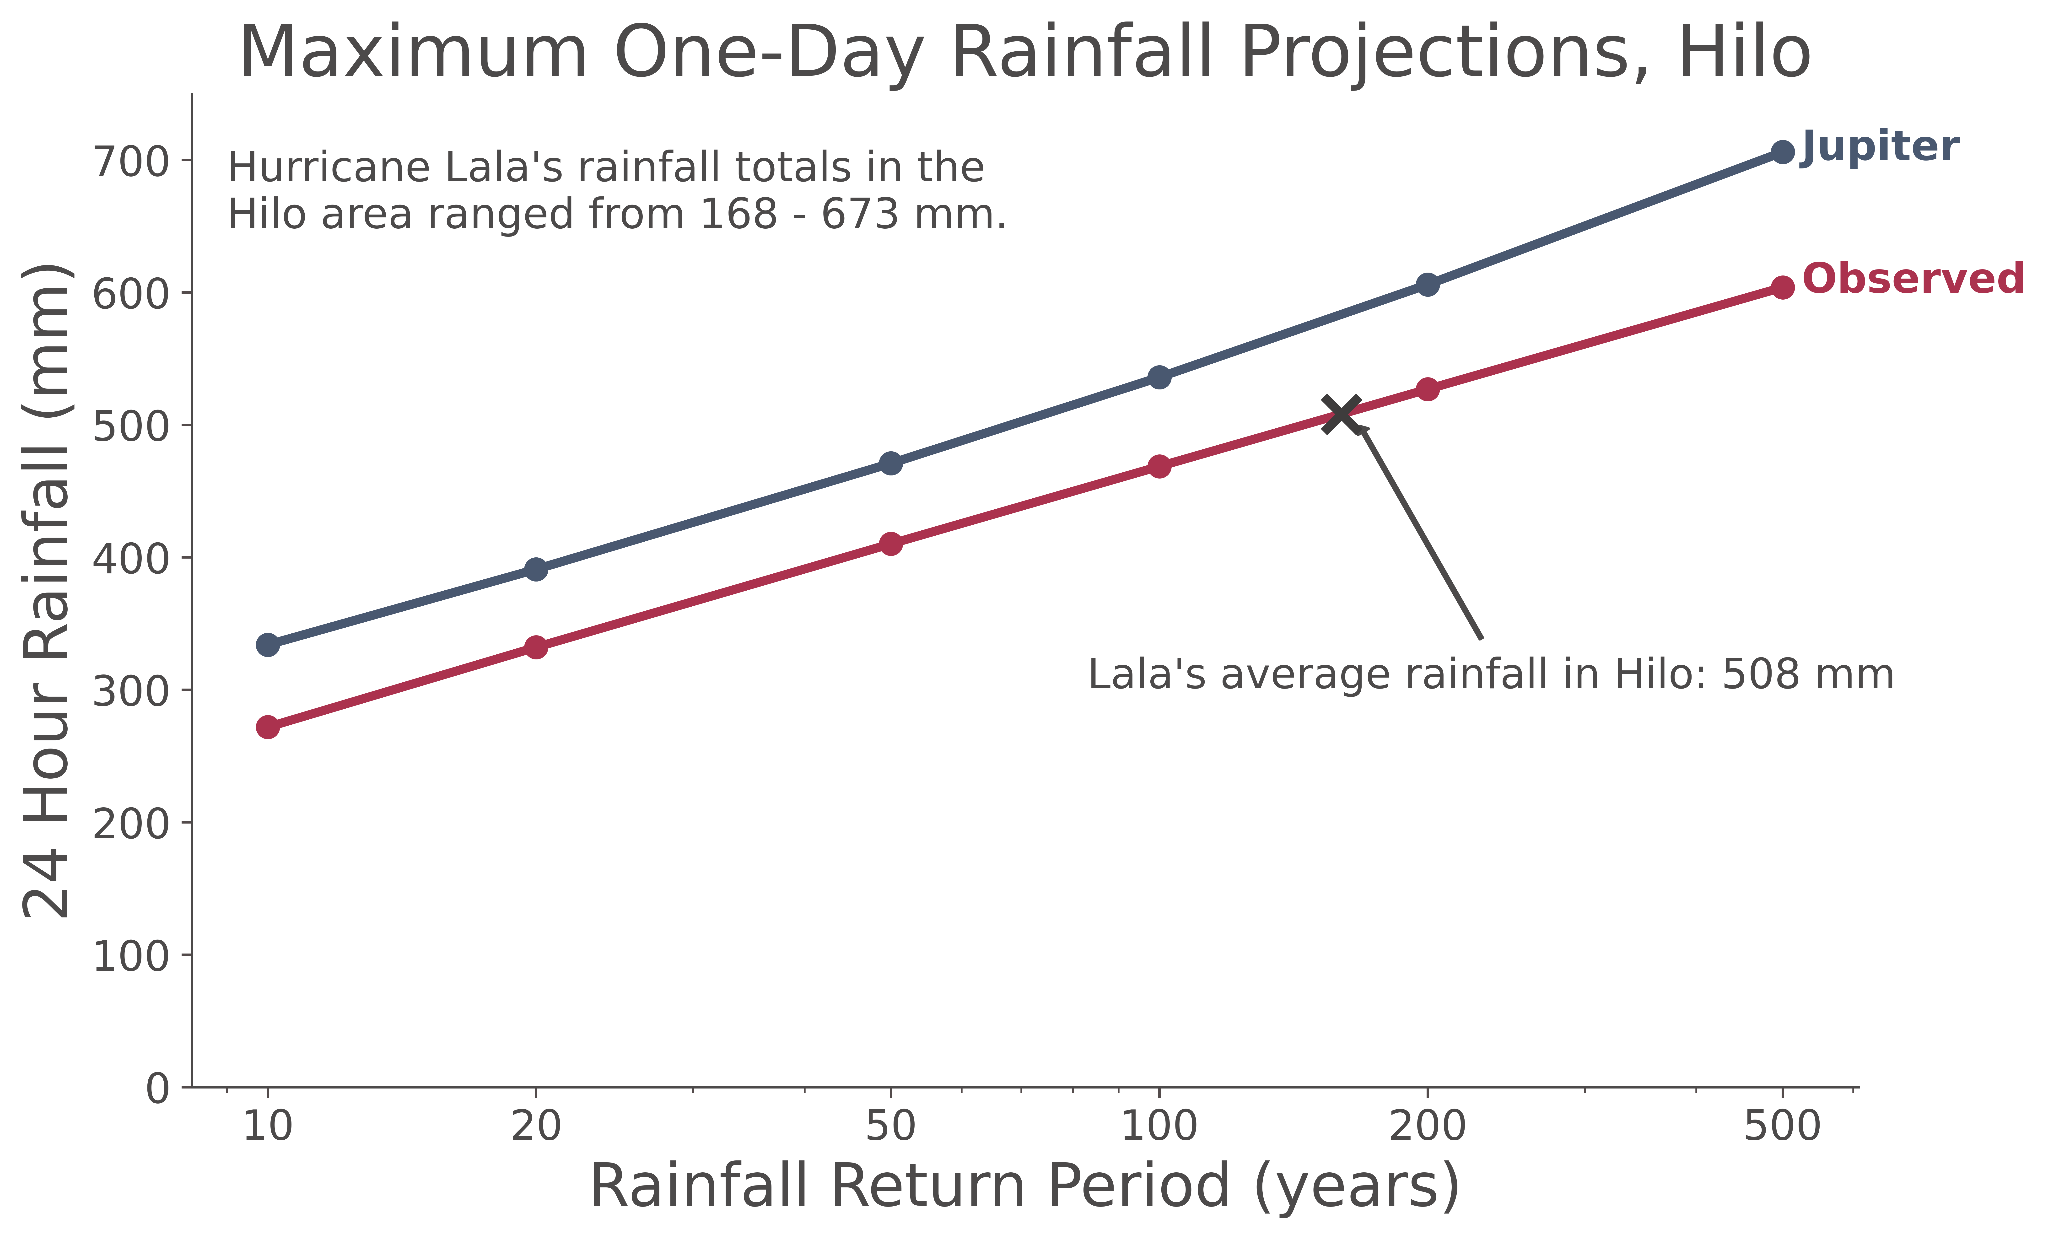
For the 120 Big Island weather stations analyzed, Jupiter models estimate that 34 stations experienced a rainfall event corresponding to at least a 1-in-50-year return period. Most of these stations were on the eastern (windward) side of the island. On the eastern side of the island, Lala’s strong winds and the rugged terrain of the Big Island enhanced rainfall, leading to rainfall totals ranging from about 250 mm (10 inches) to over 725 mm (more than 28 inches). In Hilo, Lala’s rainfall totals varied from 168 mm to over 650 mm. Using the Hilo Airport’s long-running weather station, and the average rainfall totals for weather stations in and around Hilo, Jupiter estimates that Hurricane Lala was a 1-in-165 year rainfall event for Hilo.
Though the Big Island is relatively small, its massive mountains mean that rainfall patterns vary dramatically, across the island. On the western side of the island, the mountains create a rain shadow, leading to much less rain falling during events like Lala. And the steep, rugged terrain means that even locations just a few miles apart can see differences in rainfall of several inches.
Extreme rainfall event like Hurricane Lala Will Get More Extreme
Extreme rain events will become more extreme in Hawaiʻi in the future. While annual rainfall totals for Hawaiʻi are not expected to change much in the future, Jupiter models predict that extreme rainfall events will become more extreme. Across the Big Island, a 100-year rain event could be 15 - 22% rainier by 2050. This could mean 80 - 100 mm (3 - 4 inches) more rain for the rainy eastern side of the island. And for the eastern shore of the Big Island, an event that brings as much rain as Hurricane Lala could become nearly twice as common by 2050. Intense rains and flooding are already disastrous for Hawaiʻi–the March 2026 floods prompted evacuation orders for over 5,000 people; left at least 100,000 without power; and brought the Wahiawa dam perilously close to failure. In a future with more rain, and more intense rainfall in short periods, Hawaiʻi’s growing risk of catastrophic flooding and mudslides could lead to an even more strained infrastructure, and put human lives at risk.
As oceans warm and extreme rain grows more extreme, the threat of back-to-back storms becomes more potent. Over the weekend, the National Hurricane Center feared that Tropical Storm Moke could bring another 15 inches of rain to the southeastern parts of the Big Island–the regions most afflicted by Lala. While Moke’s strongest rains ultimately remained south of Hawaiʻi, scientists have predicted that Hawaiʻi’s exposure to tropical cyclones is growing–meaning the risk of multiple extreme rain events in short order remains very real. In March, two Kona storms affected Hawaiʻi in less than two weeks, inundating the islands with over 50 inches of rain in some places. Ultimately, these two back-to-back storms cost over $1 billion.
El Niño Is Fueling Pacific Hurricanes
Tropical cyclones rarely directly hit the Hawaiʻian Islands. Hawaiʻi is a small target in a very big ocean–Lala is only the 12th storm in recorded history to come within 50 miles of the Hawaiʻian Islands. But this summer, Hawaiʻi’s oceans are 0.5 - 1°C (1 - 2°F) warmer than normal, and the waters where Lala formed were as much as 2°C (3.8°F) warmer than normal. The source of this warm water? El Niño. El Niño has been warming the Pacific Ocean, providing additional energy and fuel for tropical cyclones.
Deep into the Northern Hemisphere’s major tropical cyclone season, the Pacific Ocean has been front and center. El Niño isn’t the only factor that affects tropical cyclone formation and movement, but it can tip the scales in favor of (or counter to) tropical cyclone formation and intensification. In the Pacific, a warmer ocean makes it easier for tropical cyclones to form, and provides more energy for the tropical cyclones that do form, helping them grow stronger and last longer. This increases the risk of tropical cyclone activity in places like Hawaiʻi, and Guam, and the Northern Marianas Islands. But in the Atlantic, El Niño’s warm waters increase the wind speeds high in the atmosphere, meaning that tropical cyclones frequently get torn apart before they really get started.
Thus far, El Niño has delivered what scientists have expected in terms of tropical cyclones. In the Atlantic, only three named storms have formed, with not a single one reaching hurricane strength–less than usual for mid-August. In the Pacific, however, the season has been very active–the Eastern Pacific has had 8 named storms, with 2 reaching hurricane strength; while the West Pacific has had 15 named storms, with 4 reaching major typhoon status–including the two super typhoons that struck Guam and the Northern Marianas Islands twelve weeks apart. And studies suggest that as the climate warms, future El Niño events could supercharge Pacific tropical cyclones even more than they already do. That said, the traditional peak of tropical cyclone activity has only just begun–tropical cyclone activity in both the Atlantic and the Pacific peaks from August until October. While at-risk communities across the Pacific should continue to expect elevated risk, Atlantic hurricane season is far from over.
This article is part of the Jupiter Research initiative, where our scientists and risk experts explore the climate forces shaping tomorrow's risks. Learn how Jupiter helps organizations quantify uncertainty, evaluate future scenarios, and make more resilient decisions in a changing climate. Contact us here.
