.webp)
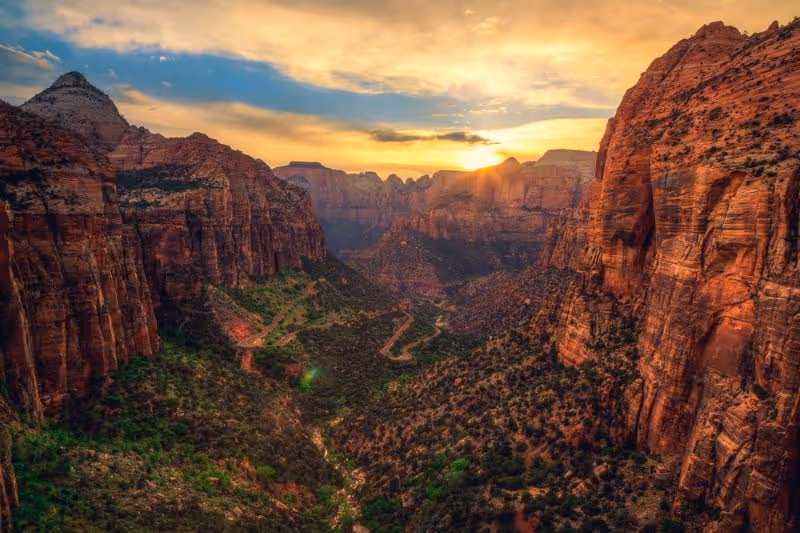
Climate Change-Driven Extreme Heat Already Poses a Serious Risk. A Future Visitor to Zion National Park Examines Its Impact on the Park’s Microclimates.
By Jenna Epstein, Solutions Architect, Jupiter Intelligence
U.S. national parks and protected lands worldwide are uniquely vulnerable to extreme heat caused by a changing climate—and even small escalations in temperature can greatly impact human and ecological health.
As temperatures continue to rise, park visitors are increasingly at risk for heat-related illnesses while toxic bacteria breed more quickly and we witness greater rates of snowmelt that trigger erosion.
This topic is especially relevant to me, because I’m planning a vacation to Zion National Park in Southwestern Utah this coming May. Temperatures in Zion have increased by 1 degree C (almost 2 degrees F) since 1985—more than other parks in the US Southwest. They vary with changes in elevation and time of day. As I prepare for my trip, I want to best understand which of Zion’s many different hiking trails are best suited for this time of year.
One Park With Many Microclimates
Zion’s total area encompasses 232 square miles (601 square kilometers) with elevation variations throughout the park, from roughly 3,700 feet (1,128 meters) to almost 8,700 feet (2,652 meters), leading to different microclimates. From sandstone cliffs dotted with sky-high trees, to arid grasslands with desert shrubs, to winding streams through slot canyons flowing with aquatic life, different sections of the park experience different climate conditions at the same time of year.
To better understand climatic variation across the park’s area in a single season, I can leverage Jupiter ClimateScore Global’s 90-meter, high-resolution climate data to understand the risks facing certain areas, especially those related to heat. Since I’m looking to the short-term, I use projections for the SSP5-8.5 scenario reflecting the current level of greenhouse gas emissions.
Heat-related distress is top of mind for me as I head for an area known for rising temperatures in late spring and early summer months. Looking at heat projections in the month of May across the geography helps me identify where I may experience more comfortable hikes, and areas I should approach with caution.
Turning Climate Data Into Decisions
When considering where to hike, I want to account for the warmest possible conditions, so I look at the upper uncertainty bound (expressed as the 95th percentile) of monthly average temperature. The southwestern portion of the park is the warmest, with projections in the mid-70s F (~23-24 C). A difference of a few degrees can be significant, especially when exercising outside in the sun for a long duration with a limited water supply.
I initially considered the Chinle Trail for a long hike, but its location in the warmest area—coupled with its fluctuation in elevation at multiple points throughout the several mile stretch—gives me pause. I’m inclined to opt for trails in the middle of the park, such as the Emerald Pools Trail, especially in the afternoons. There are still some trails in the warmer pockets that I’d love to visit, such as the Canyon Overlook Trail, but I’ll consider these for early-morning hikes, before the temperature reaches its peak for the day.
Drought conditions exacerbate additional risks associated with heat. Rising air temperatures enable deadly, cyanobacteria-bearing algae to thrive in the park’s still and flowing waters; without rainfall, these algae continue to bloom. There is a proliferation of this bacteria in the Virgin River, which flows through the popular hiking trail called The Narrows. As I consider embarking on this iconic hike, which requires wading upstream through the river, keeping my head fully above the water is crucial to avoid sickness associated with ingesting the toxins.
Preparing for Longer-Term Resilience
As we consider strategies for longer term resilience in parks and other protected lands, we can also leverage another one of Jupiter’s heat metrics: wet bulb globe temperature (WBGT). This metric uses air moisture content, temperature, solar irradiance, and wind speeds to determine how effectively humans can cool themselves. Under SSP5-8.5 projections, Utah national parks will experience a drastic increase in the number of days where WBGT is high (above 32C/90F ); by 2100, these parks will annually face between 15 to 30 high WBGT days. More days above this threshold will escalate risk of visitors experiencing heat-related illnesses.
Beyond human health, the park’s wildlife will also face increasing struggles as temperatures rise and drought conditions persist. Jupiter’s drought peril metrics at 90 meter resolution—from water stress to meteorological drought—can help us identify specific park areas and their species that would face water scarcity.
Understanding the Changes to Microclimates
High-resolution data is used in agriculture and forestry to assess diverse conditions across expansive areas with varying climatic conditions. Understanding climatic nuances is also key when considering where to prioritize longer term strategies to mitigate the impacts of extreme heat and drought conditions on national park visitors and the overall ecological health of these vital places of refuge for people and wildlife.
To learn more about how ClimateScore Global can help assess acute and chronic physical risk, including impacts on microclimates, please reach out and schedule a demo today.
