

This post discusses verification and validation of Jupiter’s heat model, providing model risk teams with evidence-based evaluation of the Jupiter heat model. First, it describes how Jupiter verifies its heat model through internal quality checks and the Jupiter Quality Score. Then, the heat model is validated using out-of-sample extreme heat observations from 2015 - 2026. The Jupiter heat model successfully predicted observed heat in major global cities 94% of the time from 2015 - 2025–and in 79% of those cities, the Jupiter heat model was consistently skillful. An in-depth look at North America and Europe reveals that the Jupiter heat model has consistently modeled recent heat extremes in North America. In Europe, the extreme heatwaves of recent years, including 2026, have caught climate models by surprise. This can be attributed to the struggles of global climate models in predicting Europe’s hottest days–events like this have not been observed, and global climate model limitations impact all climate risk projections, including Jupiter’s; new developments can help.
Extreme Heat Kills Half a Million People Every Year–and the Numbers Are Rising
Extreme heat is a silent, global killer. Extreme heat does not destroy buildings and reshape communities overnight in the wake of a single disaster. Its damages are less visible–but no less consequential. Every year, extreme heat kills an average of 540,000 people across the globe. In the hottest years, like 2023, this number can rise to over 700,000 deaths. Extreme heat is the deadliest natural hazard facing temperate regions, like Europe and East Asia, where over 50,000 people can die due to extreme heat in a single year, and hundreds of thousands may seek medical treatment. In hotter countries like India, a single day of extreme heat can cause approximately 3,400 excess deaths; while in rapidly industrializing (and blazing hot) Southeast Asia, an estimated 670 million people are exposed to the compound threats of extreme heat and heavy air pollution. Even in industrialized countries with high air conditioning usage like the United States and Canada, extreme heat is a major health burden, killing over 20,000 Americans since 1999 and nearly 1,000 Canadians since 1981. Every year in the United States, at least 25% of the population is exposed to extreme heat, and an average of 65,000 people per year require medical treatment for heat-related illness. In hot years, like 2023, these numbers can easily double.
The health risks of extreme heat have risen quickly in just the last 30 years. The Lancet estimates that global heat-related deaths have increased 60% in the 2010s compared to the 1990s. In Europe, deadly heatwaves have killed over 40,000 people in 3 of the last 5 years–including an estimated 50,000 deaths this year. Excess heat during the 2024 Hajj killed an estimated 1,300 pilgrims, and thousands more required medical treatment. In Brazilian cities, heat has claimed over 55,000 lives from 2000 - 2018. Two-thirds of Canada’s heat-related deaths have occurred in the last 10 years. And the risks will continue to grow in the near future. By 2040, heat-related illness could double in the United States. In Europe, the best-case scenario for cooler countries like the Netherlands could be a 23% increase in heat-related deaths–while hotter cities like Barcelona could see heat-related deaths triple in the next 20 to 25 years. Even famously temperate countries like England and Wales face major heat threats. In England and Wales, excess heat could be responsible for 2,000 deaths per year by 2050 in the best-case scenario–a 4-fold increase over historical heat-related mortality. The worst case scenario could see 10,000 excess deaths per year. And in hotter locales like the Gulf Coast or south Asia, extreme heat could approach or exceed the limits of human habitability.
Heat risk is global–but it’s not borne equally. Lower income people face greater threats from heat risk in a variety of ways, including a lack of access to cooling, less green space, and more poorly insulated homes. Regions like southern Europe and Japan face the double threat of rising heat risk and an aging population, creating potential heat mortality hotspots in the next two decades–although countries like Mexico have seen sharp increases in heat-related mortality in young people. Ultimately, the World Health Organization estimates that 2.4 billion workers are exposed to extreme heat each year–and over one-third of them suffer from heat-related health impacts.
Extreme Heat Cost the Global Economy Over $1 Trillion Last Year
Extreme heat eliminates billions of labor hours, and trillions in economic activity. In 2025, scientists estimate that 573 billion labor hours were lost to extreme heat, representing a loss of US$1.07 trillion in income–nearly 70% of which were from agriculture and construction. Like the health impacts of extreme heat, the financial impacts have risen rapidly across the world. In the United States, extreme heat was responsible for $220 billion in productivity losses in 2023–a 70% increase compared to the early 2000s. In 2024, both Japan and South Korea lost over 1 billion labor hours each due to extreme heat–representing a loss of approximately one week of work per worker across the entire country, and approximately double the productivity losses of the 1990s. In the Gulf Coast countries, nearly 84% of the workforce is exposed to extreme heat–and by 2030, heat stress could eliminate anywhere from 0.5 - 5.3% of labor hours throughout the Gulf, equivalent to over 350,000 full-time jobs’ worth of hours. In 2024, agricultural and construction workers alone lost nearly $700 billion in earnings–a figure that has more than doubled since 1990. These workers also face a growing risk of workplace injuries as temperatures warm, in addition to heat-related illness.
Single heatwaves can generate billions in energy, agriculture, and infrastructure losses. In London, a single 3-day heatwave resulted in £8 billion ($11 billion) in lost fare revenue for the Underground, while a single heatwave in British Columbia was responsible for C$8 - $14 billion ($5.7 - $10 billion) in excess cooling costs, C$10 billion ($7.2 billion) in infrastructure damage, and C$40 million ($28 million) in agricultural losses. By 2040, extreme heat is projected to cause up to $26 billion per year in road maintenance and repair costs in the United States. Energy costs are also rising quickly–in Europe, the energy used for cooling has doubled between 2018 and 2024. Globally, crop losses for barley, maize, and wheat have already dropped 4 - 13% due to rising heat. As the heat rises, energy grids, infrastructure, and agricultural systems face increasing strain.
The economic impacts of extreme heat are rising quickly. For several European countries, cumulative GDP losses attributed to extreme heat could exceed €100 billion ($111 billion) in the next 4 years. As early as 2030, extreme heat is projected to lower France’s GDP by €209 billion ($233 billion), Italy’s by €128 billion ($143 billion), and Germany’s by €124 billion ($139 billion). As early as the 2030s, extreme heat could reduce GDP by as much as 5% for several major cities in Central and South America, such as Lima, Bogotá, Mexico City, and Brasília. As these cities can create anywhere from 10 - 25% of national economic activity, this is a major nation-wide impact. Similarly, São Paulo, which generates an estimated 9% of Brazil’s GDP, could see its GDP reduced by over 1% in the next 25 years.
Extreme heat compounds other risk factors. Beyond its own direct impacts, extreme heat is a compounding factor for other physical risk. Extreme heat sharply increases the risk of drought and wildfire, which can in turn exacerbate the impacts of extreme heat. And extreme heat compounds itself. In many cases, the impacts of multiple hot days stack non-linearly, providing much more destruction than individual hot days. The frequency and duration of the most intense heatwaves is projected to increase the most, and the likelihood of back-to-back heatwaves, which create outsize impacts on health, infrastructure, and energy could increase substantially in the next 25 years.
Heat Risk Modeling at Jupiter
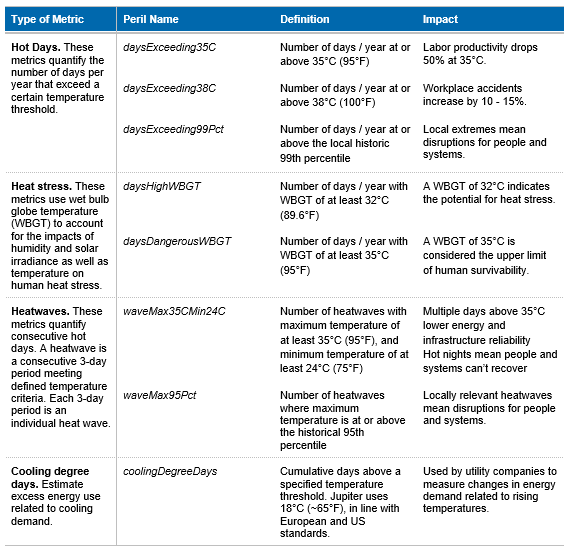
Jupiter’s heat model integrates global climate model (GCM) simulations, global reanalysis products, weather station observations, and satellite-derived land-surface characteristics to make highly localized estimates of extreme heat exposure. The Jupiter heat model uses a variety of extreme heat metrics that quantify the variety of ways in which extreme heat threatens human health, labor productivity, infrastructure, operational efficiency, and energy resilience and cooling demand. Jupiter’s heat metrics include both fixed thresholds and relative thresholds. The fixed thresholds represent temperatures at which health, energy, operational, or infrastructure impacts are significant. The Jupiter heat model also uses relative thresholds, as the fixed thresholds may not be especially relevant for local extreme heat. For example, in the United Kingdom, temperatures above 35°C (95°F) are extremely rare, and the impacts of extreme heat can be seen at temperatures below 35°C (95°F). Alternatively, for many tropical locations, temperatures regularly reach 35°C (95°F), and thus, that temperature may not be particularly extreme for those populations and communities.
Jupiter’s extreme heat perils are summarized in Table 1. We note that for relative perils, such as the number of days where the maximum temperature exceeds the 99th percentile (daysExceeding99Pct) and the number of 3-day heatwaves where maximum temperature exceeds the 95th percentile (waveMax95Pct), percentiles are calculated based on historical (1980 - 2010) values. We also note that in Jupiter’s heatwave metrics, each 3-day period is counted as a separate heatwave. Thus, 7 consecutive days meeting the heatwave threshold would be counted as 5 individual heatwaves. Finally, cooling degree days measure the difference between the ambient temperature and a threshold temperature. The Jupiter heat model uses 18°C (64.4°F) as a threshold, which corresponds to typical thresholds in both the United States and Europe. If a day’s ambient temperature is 35°C (95°F), then 17 cooling degree days are counted for that single day. Jupiter’s extreme heat metrics are cumulative, meaning they count the number of days per year that reach a specified temperature threshold.
Global climate models provide historical and future estimates of gridded daily maximum and minimum temperatures, relative or specific humidity, sea level pressure, and topographic height data. All extreme heat metrics use daily temperature data. The historical GCMs are calibrated using ERA5 global reanalysis for the period 1980 - 2010. Extreme heat perils for historical and future periods are computed using statistical modeling and Extreme Value Theory.
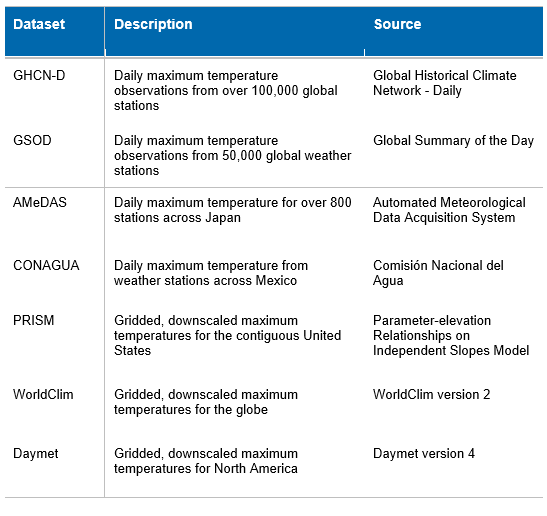
For some heat metrics, Jupiter uses observations from thousands of global weather stations to perform machine learning-enhanced downscaling. In total, the Jupiter heat model has identified observations from over 32,000 global weather stations that meet longevity and quality control standards. Land use and land cover data at 100m is provided by the Copernicus Global Land Surface dataset. The weather station networks used for the enhanced downscaling are listed in Table 2.
Verifying the Heat Model: Checking for Internal Consistency
At Jupiter, the process of verification refers to quality control steps occurring during the production of perils. This ensures that model outputs are reliable, realistic, and physically consistent. Each peril has its own verification pipeline that includes software engineering checks, technical and cross-level checks performed by Jupiter’s science experts, and checks against external data where available. Each peril, scenario, and epoch (defined in Figure 1) goes through the verification process.

For the Jupiter heat model, the Jupiter Quality Score (JQS) is created from the following tests:
- Verifying minimum and maximum reasonable values. For metrics that quantify the number of days per year that exceed a certain threshold, values should always be between 0 and 365. Metrics that quantify 3-day heatwaves should always be between 0 and 363–two days less than a full year, as an event must be at least 3 days long to qualify as a heatwave.
- Calculating an uncertainty range. The difference between the 5th and 95th percentiles must always be greater than 0. For many locations, such as the tropics, maximum temperature ranges can be fairly narrow–thus, a small shift in future temperatures could lead to a large number of days exceeding a particular threshold. For this reason, the maximum uncertainty range is quite large, at 180 days / year for daysExceeding metrics, and 363 heatwave days / year for heatwave metrics.
- Checking the difference across metrics. For all locations, daysExceeding35C should never be less than daysExceeding38C. Similarly, daysHighWBGT should never be less than daysDangerousWBGT.
- Checking the difference across consecutive years. Scientists expect that heat metrics will have a strong positive trend. Year-over-year trends are positively skewed.
- Checking the deviation from the year-to-year trend. Any unusually large deviations from consistent year-to-year trends are flagged for further review. Jupiter experts determine the appropriate thresholds for each metric.
- Ensuring values vary reasonably in space. While heat can have localized variations due to changes in land use and land cover, unusually large variations from one grid point to another could indicate problems. Jupiter experts ensure that adjacent locations do not vary too much from each other.
- Missing data. All heat metrics are checked to ensure that there is no unexpected missing data, and that metrics exist consistently for all forecast years at all locations.
The Jupiter Quality Score (JQS) tests are done for all heat metrics at all locations, for all years, and all emissions scenarios. The final JQS is created by averaging the heat model results across all metrics and years within an epoch, as well as for all locations within a region. A JQS of 100 means that the heat metrics mass all JQS tests for each location in that region for a given epoch. Every time some combination of metric, scenario, year, uncertainty level, and epoch does not pass, the JQS decreases slightly. A JQS of at least 50 is considered a good score, and a JQS of 100 should not be interpreted as a perfect model–rather, it’s simply an indicator that the heat model passed the quality control tests listed above for each scenario.
Ultimately, the JQS for the Jupiter heat model is consistently very high. Every region, in every epoch, scores at least a 99.94. When scores do drop below 100, these decreases are usually related to values exceeding the uncertainty range, or to values where changes across consecutive years fall outside of the specified range. These deviations happen infrequently, with the lowest score being a 99.94, and many regions receiving scores of 99.99 or higher across all epochs.
Validating Jupiter’s Heat Model Against the Real World
The Jupiter heat model has been successfully verified. The next step is validating the heat model against real, observed heat. For the heat model, the validation process is intended to ensure that the Jupiter heat model is correctly identifying extreme heat exposure in various locations across the globe. We note that unlike some other perils, the Jupiter heat model does not estimate exceedance probabilities, or provide return period estimates. We also note that nearly everywhere has some exposure to extreme heat. Thus, when we validate the Jupiter heat model, we focus on systemic underestimation of heat exposure.
The Jupiter heat model provides an improved global estimate of extreme heat when compared to a global reanalysis product
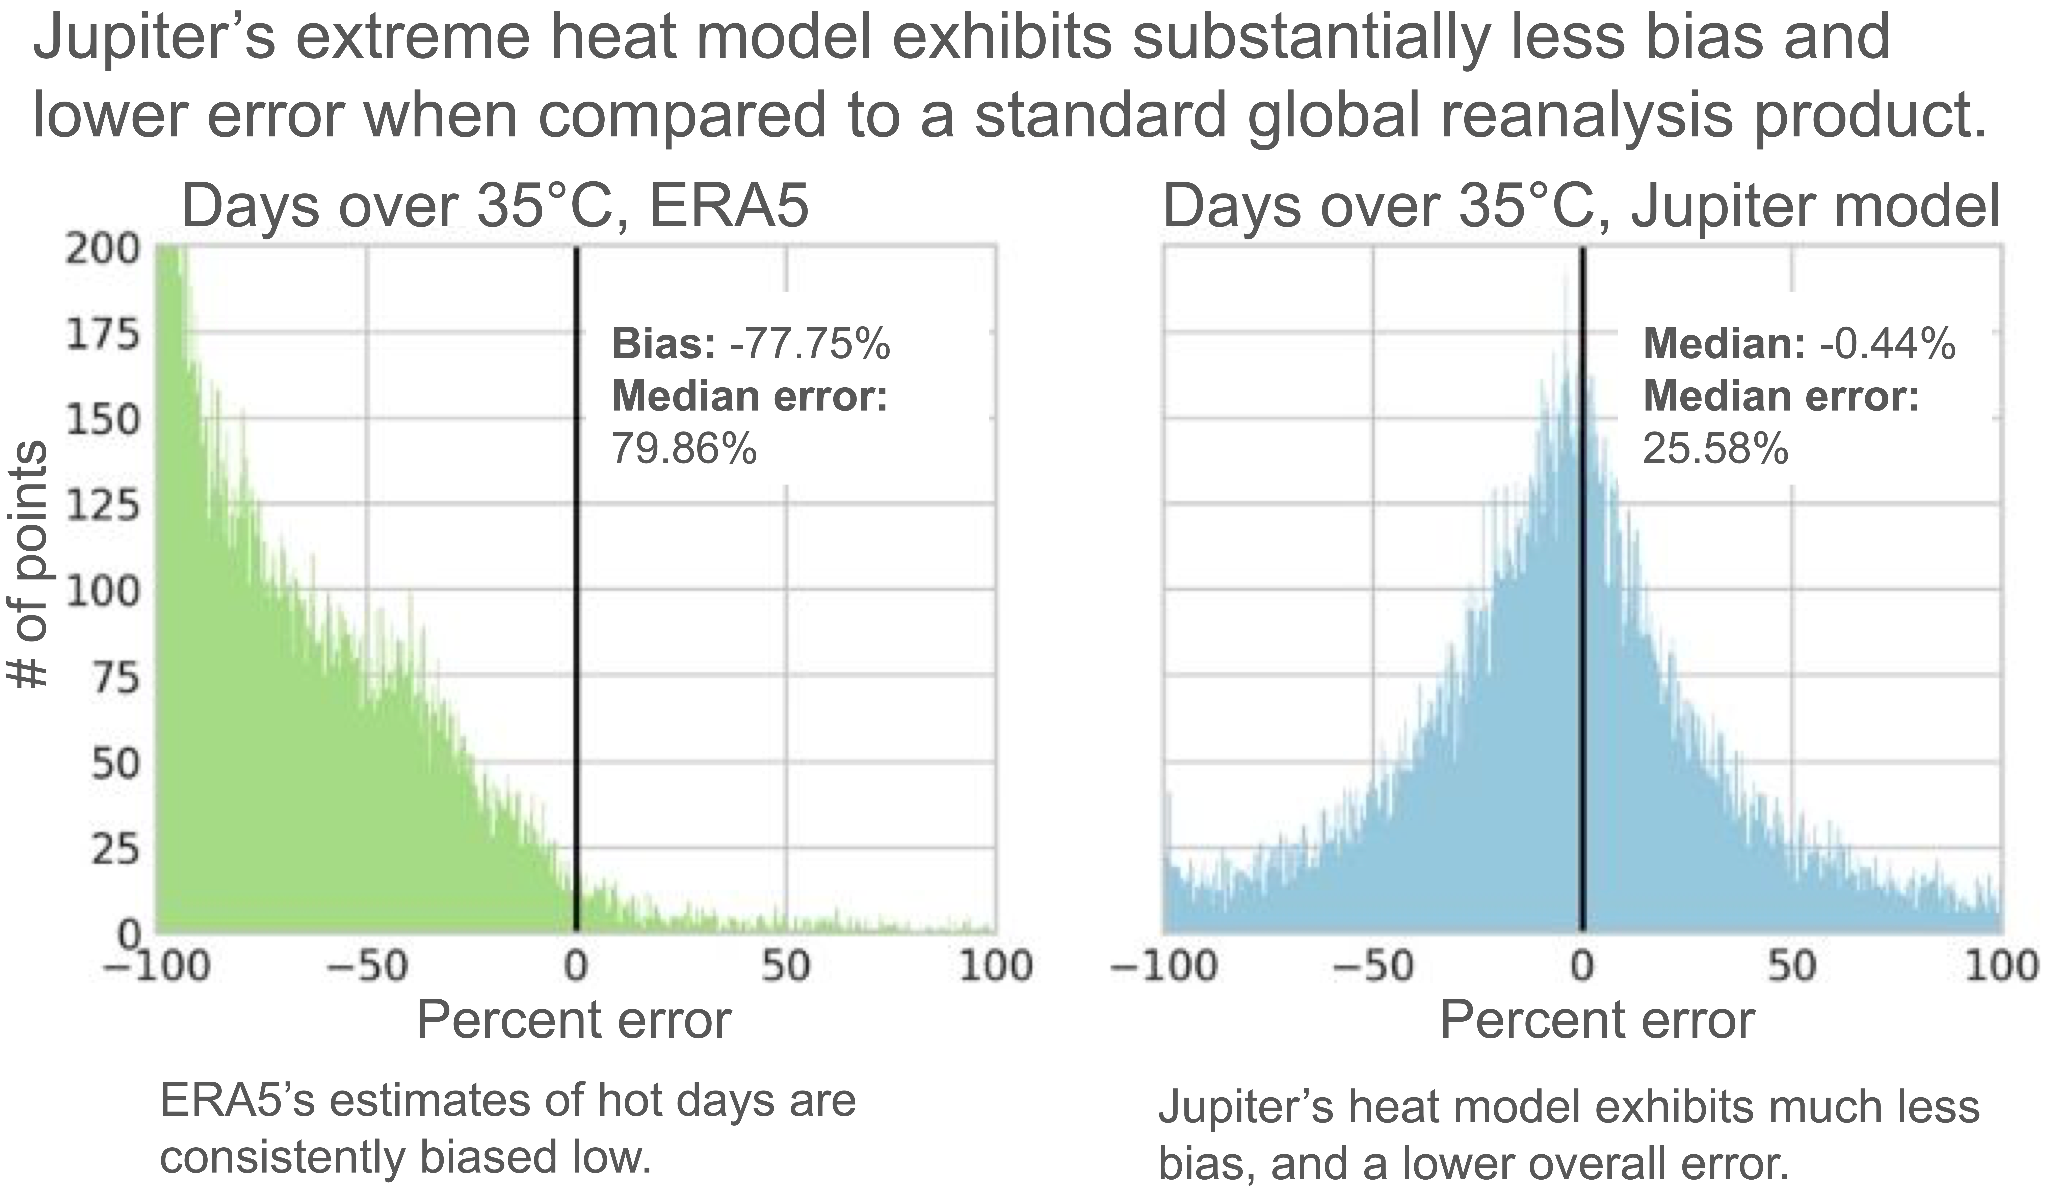
Over the historical period, we estimate how closely Jupiter’s heat model represents observed heat, and how the Jupiter heat model compares to the global standard reanalysis product used for climate studies. For both the Jupiter heat model and ERA5, we calculated the number of days above 35°C (95°F) across the globe, and compared these estimates to over 30,000 global temperature observations from 1986 - 2005. We found that while ERA5 consistently underestimated the number of hot days, Jupiter’s heat model, which combines ERA5 with observations from thousands of global weather stations and satellite products, had much less bias. We also found that Jupiter’s heat model had a lower overall mean absolute error–25%, compared to 80% for ERA5. Thus, Jupiter’s high-resolution model and enhanced downscaling compares quite well to observed temperatures, and exhibits much less bias than ERA5 reanalysis.
Has Jupiter’s Heat Model Predicted the Extreme Heat of the Last Decade?
Jupiter’s heat model has skillfully modeled extreme heat during the baseline era, providing improved estimates of extreme heat over ERA5 alone. However, the planet has been warming quickly. Some climate scientists have estimated that the rate of global warming has accelerated in the last 10 years. Others have identified global heatwave “hotspots”, where the hottest days are warming faster than climate models have predicted. Therefore, it is reasonable to wonder if a model trained on observations from 1980 - 2010 can skillfully predict the heat of the past decade.
With that in mind, we compare the Jupiter heat model’s extreme heat predictions to observed heat extremes from 2015 - 2025. Since heat has increased rapidly in recent years, we use the Jupiter heat model’s extreme heat predictions for the year 2025, under the high emissions scenario (ssp5-8.5), rather than the historical baseline period. We note that at such short timescales, the choice of scenario matters very little. We also note that since the Jupiter model was calibrated using data from 1980 - 2010, analyzing temperature data from 2015 and later satisfies our goals of out-of-sample validation.
For each of Jupiter’s extreme heat metrics, we produce a mean prediction, as well as 5th and 95th percent confidence bounds for each prediction. This means that statistically, we can expect approximately 10% of observations for each location to fall outside of the confidence bounds. Since the extreme heat metrics are calculated as the number of days per year that exceed some threshold, we can reasonably expect 1 or even 2 years out of 11 to exceed Jupiter’s predicted uncertainty threshold.
We also note that for temperature, like many other geophysical variables, we must challenge assumptions of temporal and spatial independence. That is, for an individual location, if Monday is hot, the probability that Tuesday will also be hot is much higher. Similarly, it is much more likely that Sunday was hot. The same is true for nearby locations. Differences in land use, urbanization, and topography can, and do, create localized temperature differences. But broadly, if it’s very hot in Kyoto, it is also likely to be very hot in Osaka less than 50 km (32 miles) away. Thus, we don’t expect hot days to be evenly distributed across our 11-year sample. It’s far more likely, and realistic, to expect some years with many hot days, and other years with fewer.
Finally, extreme heat is primarily a right tail risk phenomenon. That is, we are mostly concerned with observations that are higher than the upper bound predicted by the Jupiter heat model. Thus, we compare observed heat to the 95th percentile predicted by Jupiter’s heat model.
The Jupiter Heat Model Captured 94% of Hot Days from 2015 - 2025 Across 268 Major Cities
Extreme heat exposure is a major concern for city dwellers. Within urban environments, extreme heat is frequently enhanced. Tall buildings, dense roofs, and pavement and asphalt absorb and trap heat, while vehicles and air conditioning further heat up the environment. A lack of parks and green space further adds to the problem by removing access to natural cooling. Across the globe, cities have already been warming 30% more than rural environments–and with urban expansion, that trend could continue.
To test the Jupiter heat model’s performance in these key urban environments, Jupiter’s science team evaluated the model’s performance in major world cities across the globe. The team compared the Jupiter heat model’s predictions for the number of days where the maximum temperature exceeds 35°C (95°F) (daysExceeding35C in Table 1) to the observed number of days exceeding 35°C (95°F) for each year between 2015 and 2025.
The observed database was created by identifying 750 largest cities worldwide (based on United Nations urban area population estimates), and refined to include only cities with daily temperature observations from 2015 - 2025 that passed Jupiter’s quality control tests (note: since data from many Chinese cities did not pass the quality control tests, Chinese cities were ultimately excluded). Finally, only cities that experience 35°C (95°F) temperatures an average of at least 2 days per year were included. In total, 268 cities passed these criteria. With 11 years of data for 268 cities, we have a total of 2,948 observations of the daysExceeding35C metric.
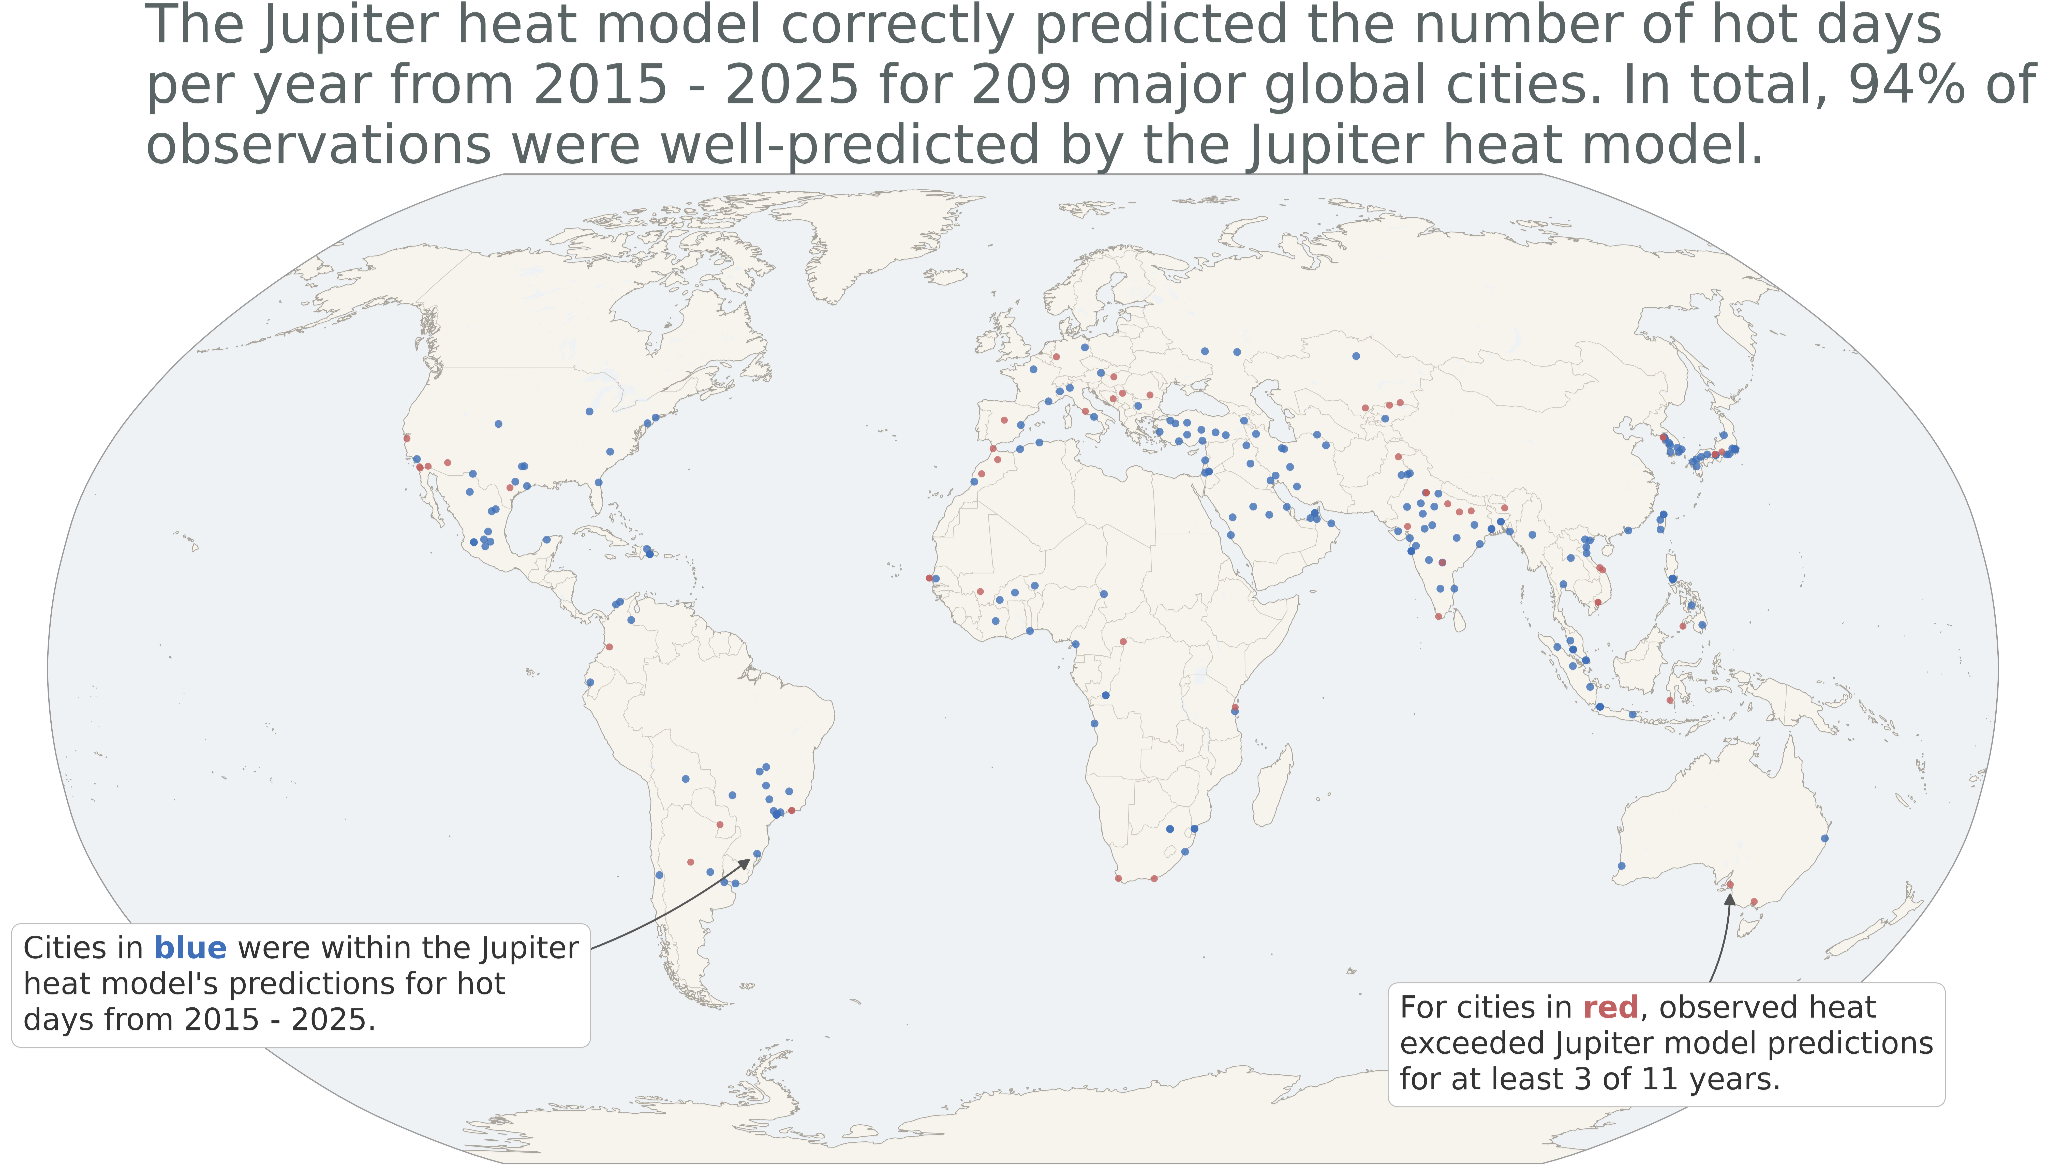
When we compared the observed number of hot days to the number of hot days predicted by Jupiter’s heat model, we found that for 68% of the cities we analyzed, the observed number of hot days was within the range predicted by Jupiter’s heat model for at least 10 of the past 11 years. And in 79% of the cities we analyzed, the observed number of hot days was within the range predicted by Jupiter’s heat model for at least 9 of the past 11 years. Thus, for nearly 80% of major global cities we analyzed, the observed heat of the last 10 years was effectively estimated by Jupiter’s heat model. These cities are shown in blue in Figure 3.
For the remaining 21% of cities (shown in red in Figure 3) where at least 3 of the last 11 years had more hot days than predicted by Jupiter’s heat model, we took a closer look. In many cities, we found that the actual difference between the upper range of hot days predicted by the Jupiter heat model and the observed number of hot days was small–often, just one or two days. As an example, consider Abu Dhabi. In Abu Dhabi, the observed number of hot days exceeded the Jupiter heat model’s predicted range of number of hot days in 3 of the last 11 years. However, upon a closer look, the actual difference in each of these years was quite small–1 or 2 days, in most cases. In a hot country like the UAE, where temperatures can easily exceed 35°C (95°F) for half of the year or more, such a small difference represents less than 1% of the total number of days exceeding 35°C (95°F), and is ultimately not decision-relevant.
With this in mind, we found that 94% of global observations (that is, 11 years in each of 268 cities) of daysExceeding35C were within 5% of the daysExceeding35C predicted by the Jupiter heat model. In most regions of the globe, we found that at least 90% of observations over the 11-year period were within the range predicted by the Jupiter heat model.
There were four regions where the heat was underestimated over 10% of the time–southern Australia, southern Europe, Central Asia, and North Africa. All four of these regions are characterized by hot, dry summers. Recent studies have suggested that global climate models have overestimated increases in humidity in hot, dry regions like these–and in sparsely populated locations like Central Asia and North Africa, the lack of high-quality observational data can make the gap even worse. Additionally, global climate models are forced to simplify some of the physical interactions between the land and the atmosphere–feedbacks that can often act to amplify extreme heat, especially in drier environments.
Modeling Extreme Heat in Two Warming Hotspots: Western Europe and North America
Both Europe and North America are warming much faster than the global average, and both regions are struggling with extreme heat. Western Europe and Arctic Canada have been identified as key heatwave hotspots, while extreme heat costs the US economy over $100 billion each year. We take a closer look at the Jupiter heat model’s performance in these warming hotspots.
We identify 1,915 weather stations across western Europe, the United States, and Canada with at least 45 years of daily temperature data across the GHCN-D and ASOS networks. Each country in western Europe and state / province in North America has at least 3 different weather stations, with the exception of Prince Edward Island in Canada. For each of these stations, we calculate extreme heat using Jupiter’s daysExceeding99Pct and waveMax95Pct metrics. The 95th and 99th percentiles are defined using the period 1991 - 2020. We calculate these metrics for each station individually, and then aggregate them at the country level (Western Europe) or the regional level (North America). We use daysExceeding99Pct and waveMax95Pct as temperatures in excess of 35°C (95°F) are uncommon for much of Europe, the United States, and Canada.
With all of this in mind, we are focused on the number of years where observed heat exceeds the upper bound predicted by the Jupiter heat model. For a given location, we can reasonably expect that over our 11-year sample, anywhere from 0 to 2 exceptionally hot years could exceed the predictions made by the Jupiter heat model. If half or more of the stations in a country or region exceed the Jupiter heat model’s threshold for one year, the Jupiter heat model is considered to have underestimated extreme heat exposure in that year. If a country or region has more than 2 years with underestimated heat exposure, we consider that country or region to be at risk of systemic underestimation.
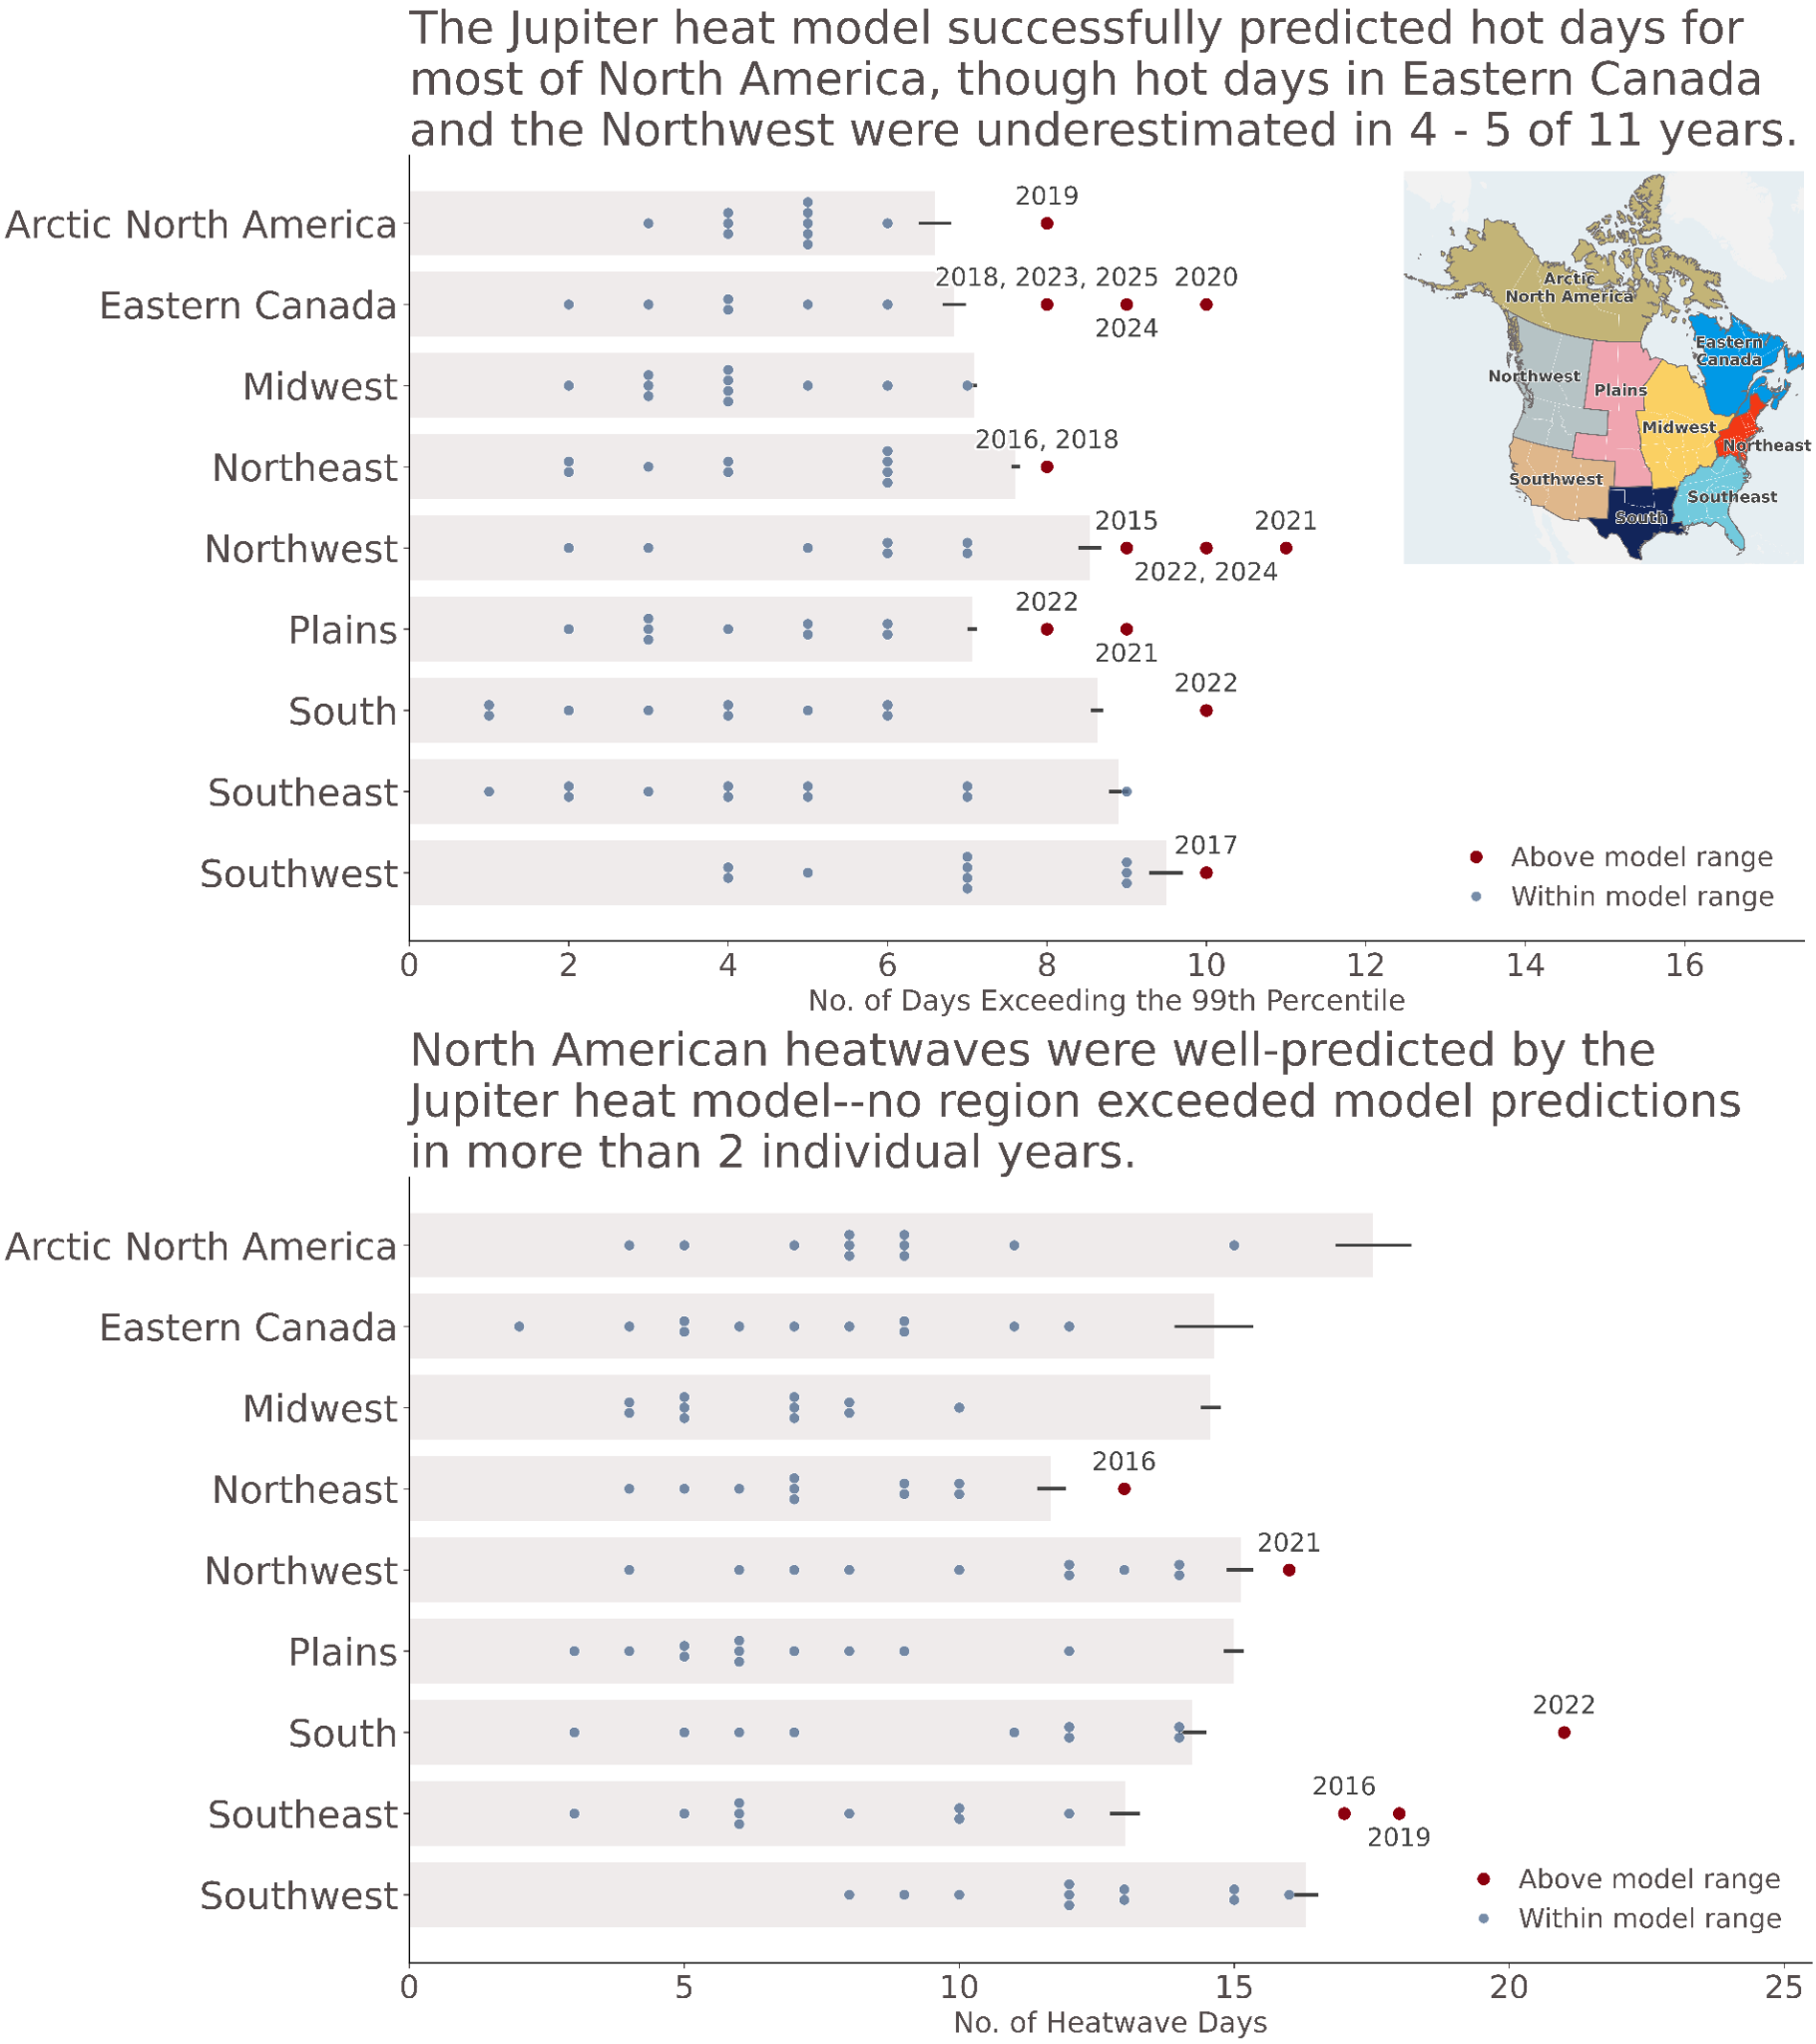
Jupiter’s heat model captures observed heat in North America–especially in the hottest places. In North America, Jupiter’s extreme heat model generally performs well for much of the region. For all North American regions, Jupiter’s extreme heat model skillfully predicts heatwave days, with no region having more than 2 years that exceed the Jupiter heat model predictions. The Jupiter heat model is slightly less skillful at predicting the number of hot days in some regions. In more northern regions, such as the Northwest and especially Eastern Canada, the Jupiter heat model underestimates the number of hot days per year in 4 or 5 of the last 11 years. Both the Northwest and Eastern Canada have had several record-breaking heatwaves in the last decade, such as the 2021 Pacific Northwest heatwave, which set Canada’s all-time heat record and killed over 1,000 people in the United States and Canada; and the 2018 heatwave that killed 33 in Quebec. Global climate models frequently underestimate temperatures at high latitudes, as well as circulation patterns that can lead to extreme heat in these regions. For example, the circulation patterns that intensified the 2021 heatwave in the Pacific Northwest–North America’s deadliest–are not well-represented in climate models, meaning that similar heatwaves may be under-represented in Jupiter’s heat model, or any other climate model-based product.
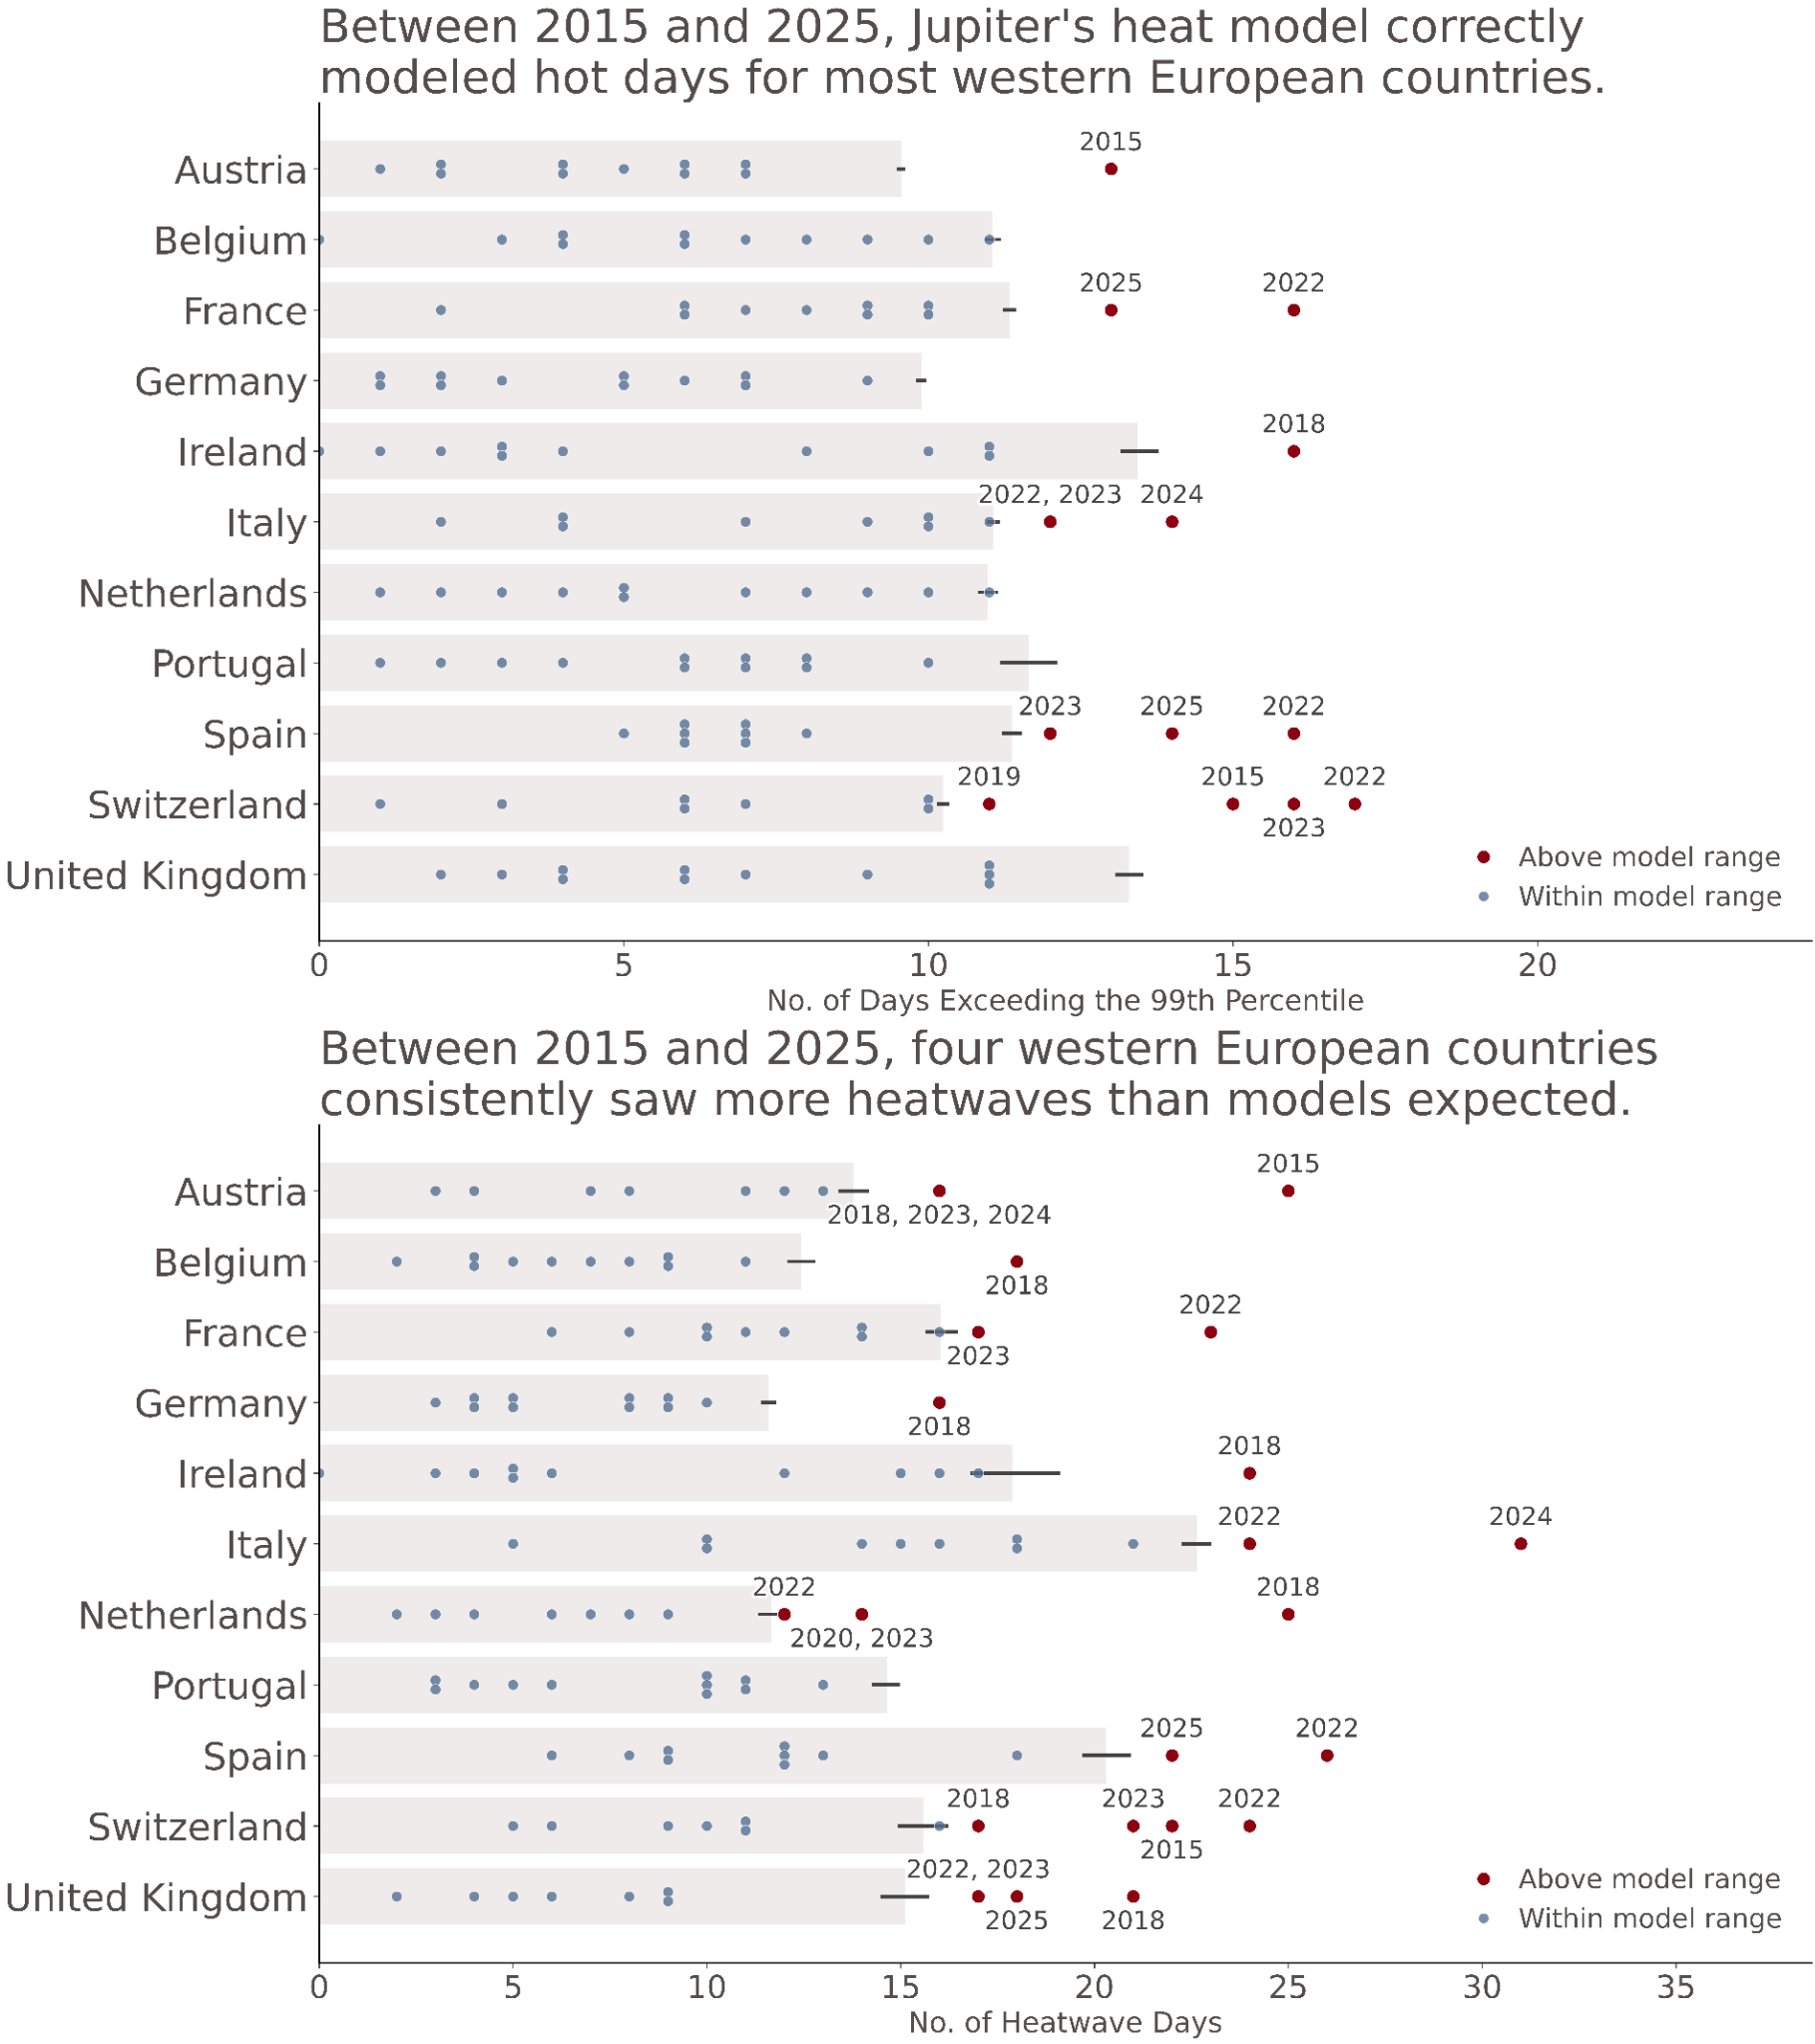
Jupiter’s heat model predicts hot days for much of western Europe, but global climate models have struggled to predict recent heatwaves. In western Europe, six of eleven analyzed countries had at least one year where the number of hot days exceeded the Jupiter heat model’s predictions. In two countries–Spain and Switzerland–three years had more hot days than the Jupiter model predicted. In many countries, the same years exceed the Jupiter model prediction. For example, 2022 was the deadliest summer on record in Europe. Italy, France, and Spain suffered from some of the highest temperatures and largest death tolls, as multiple heatwaves afflicted this region throughout the summer. The United Kingdom also set a national temperature record in 2022. But in the UK, the most extreme temperatures were largely confined to southeastern England, and not all of the heatwaves afflicted the UK. Thus, while parts of the UK did suffer from very high temperatures in the summer of 2022, the majority of the UK’s weather stations did not exceed the Jupiter heat model’s predictions for daysExceeding99Pct.
While hot days have only been widely underestimated in a few countries, heatwaves have been more systematically underestimated across Europe. All countries but one have at least one year where heatwave days were underestimated, and many countries have 2 or more years where observed heatwaves exceed the Jupiter heat model’s predictions. The countries suffering from the most systemic, widespread underestimation of heatwaves include the mountainous countries of Switzerland and Austria (another region where climate models often underestimate the hottest temperatures), as well as northern countries like the United Kingdom and the Netherlands. That is, the Jupiter heat model’s skill is directly impacted by the skill of global climate models at capturing observed trends.
An Extreme Year in Focus: Analyzing the Exceptional Heat of 2026
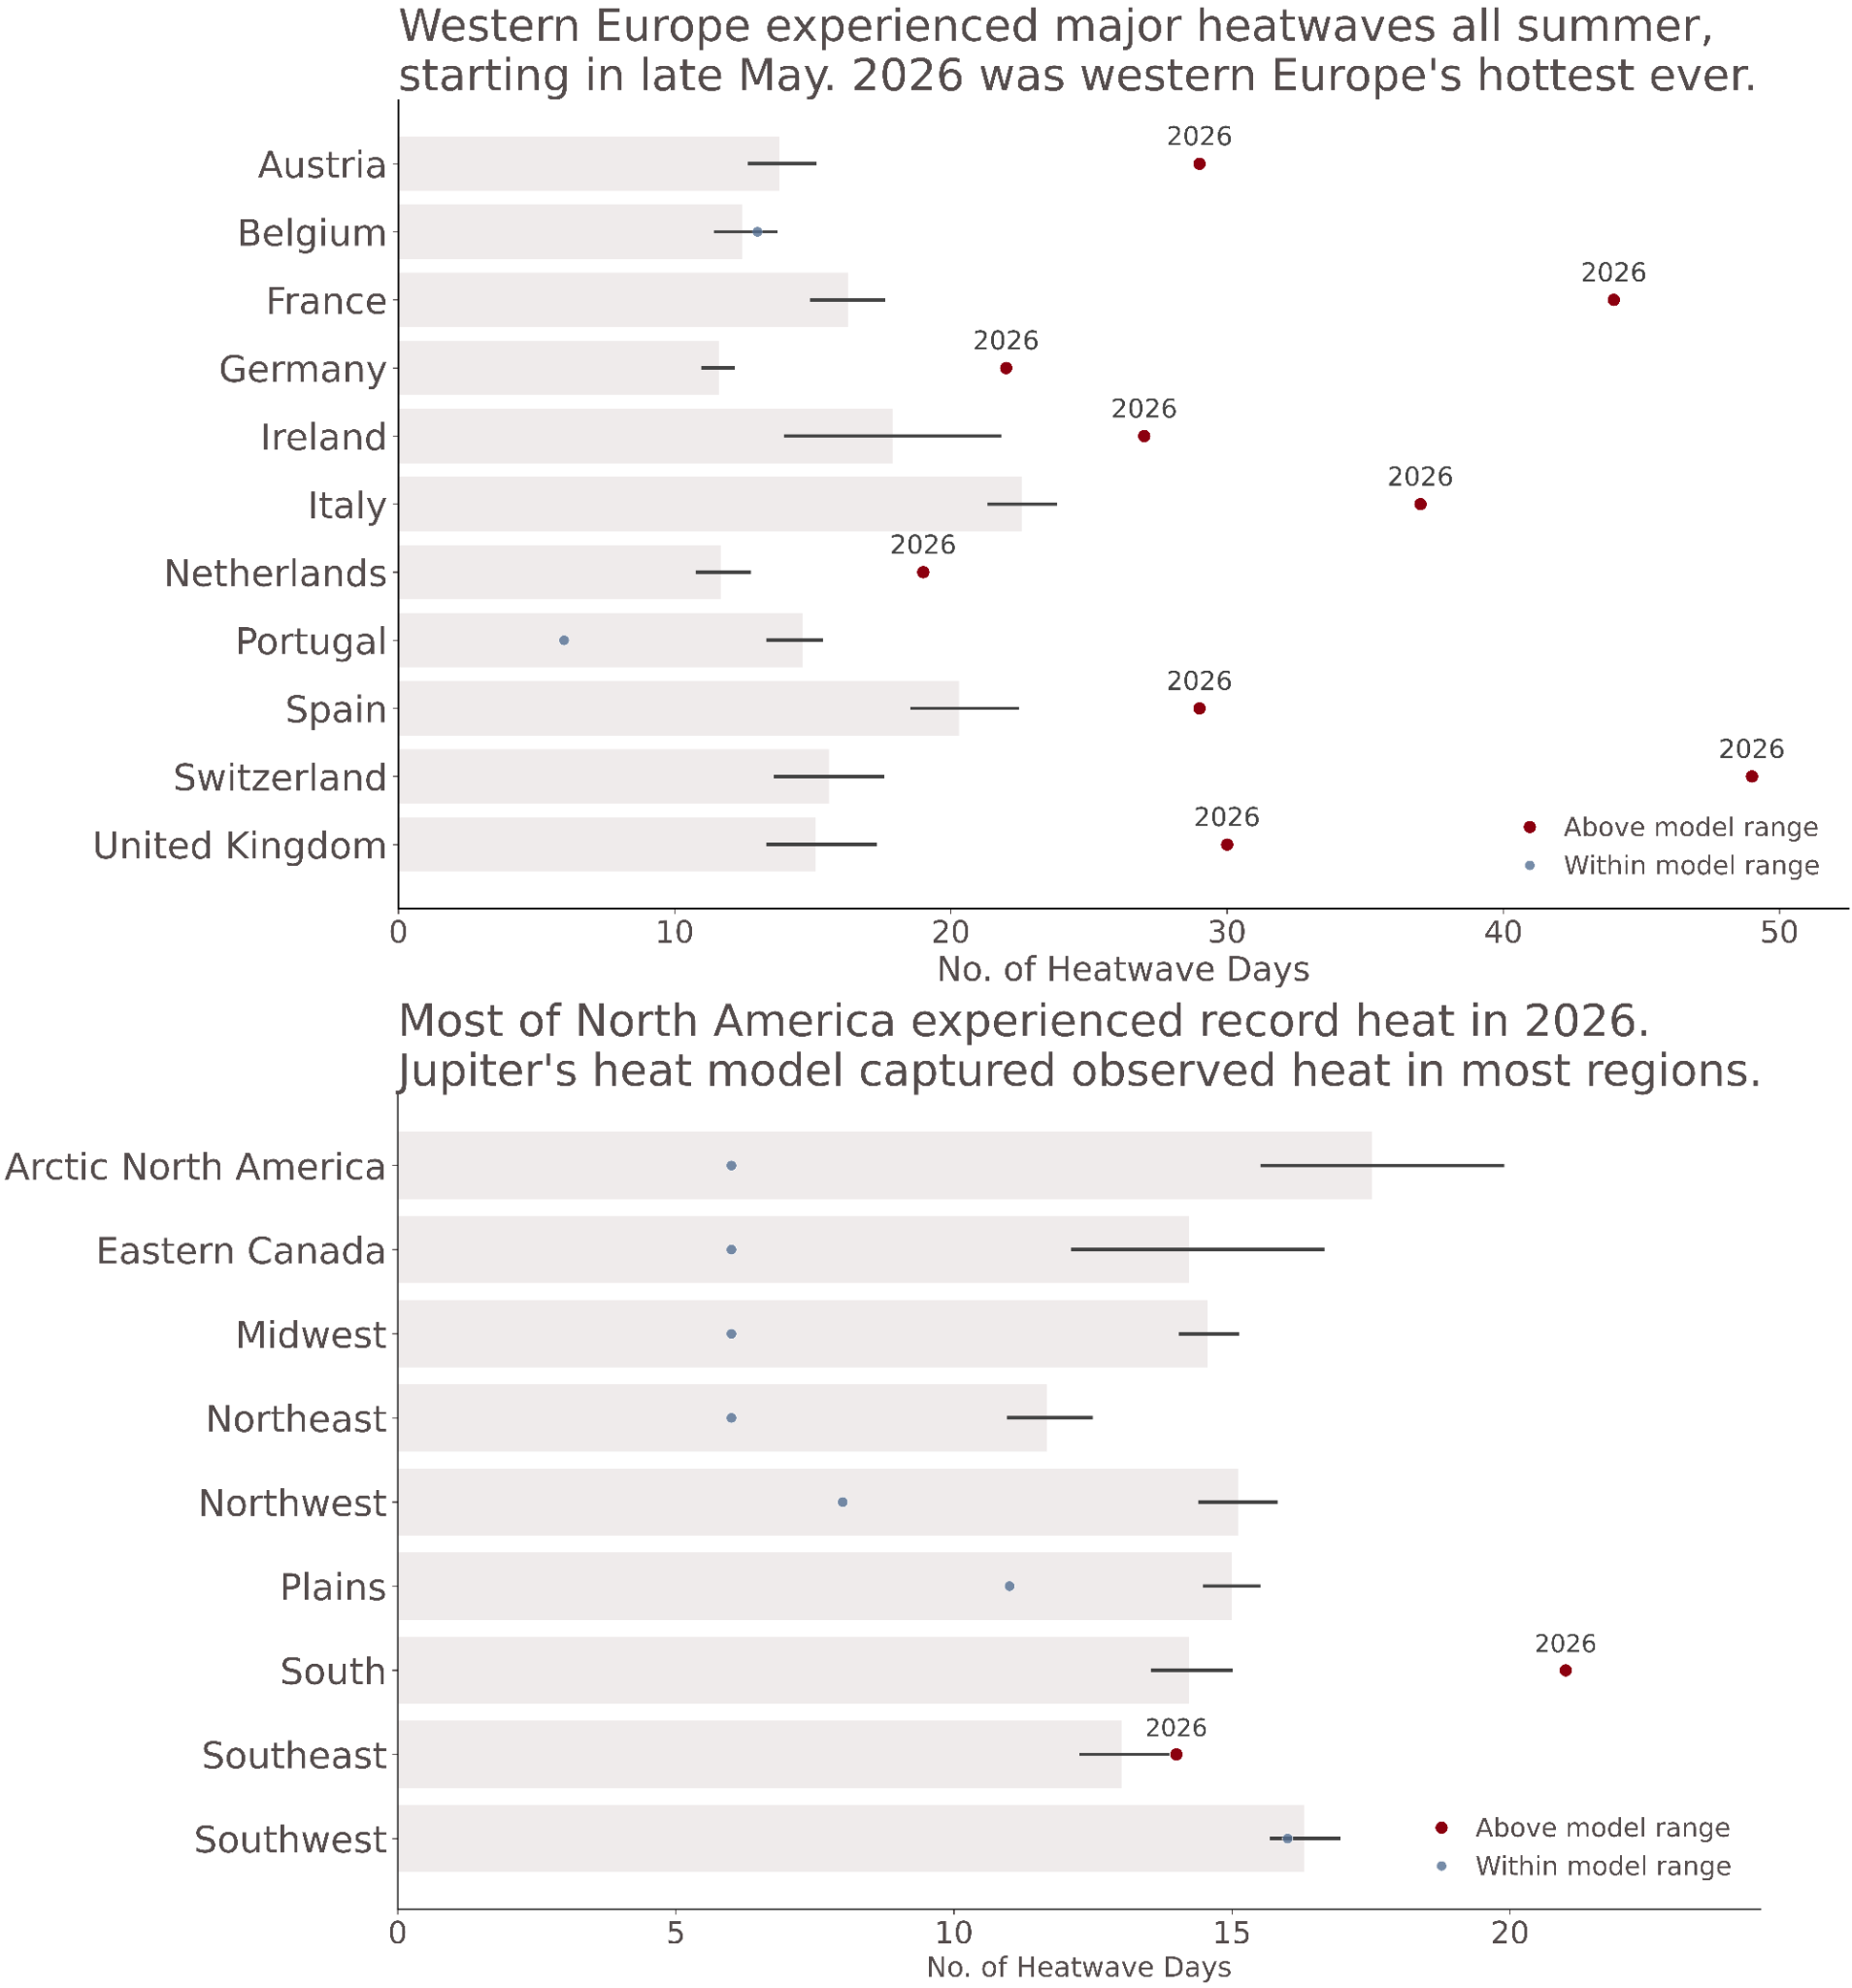
Western Europe’s extreme heat was far above anything global climate models could have predicted. August 2026 wasn’t just the hottest month the world has ever seen–it marked the end of a summer full of record-shattering heat in western Europe. Summer 2026 was western Europe’s warmest ever, with Germany, Austria, and France all setting new national temperature records. Across western Europe, the average temperature was 2.5°C (4.5°F) warmer than normal. Heatwaves that started in May have caused at least 50,000 heat-related deaths between May and August, according to preliminary research. And extreme heat combined with very little precipitation helped fuel massive wildfires in Spain and France, and led to low river levels that further strained the energy grid.
This year’s record-shattering heat was so extreme that it was far above Jupiter model predictions for most countries in western Europe. Both hot days and heatwave days were underestimated by a factor of 2 for many countries For France and Switzerland, the Jupiter heat model underestimated hot days by nearly a factor of 3. And for nine of eleven countries, the Jupiter heat model underestimated the number of heatwave days by at least a factor of two.
In 2026, the heat in western Europe was exceptional in every possible sense. Given the lack of observations of heat of this magnitude in the historical record, we are left with global climate models as the most reliable source of information beyond seasonal prediction timescales. This year is a prime example of the challenges global climate models have faced predicting the last decade of extreme heat in Europe. Climate scientists have identified western Europe as the strongest heatwave hotspot–locations where the hottest days are warming much faster than global climate models have predicted. For western Europe, one of the key factors behind these unforeseen trends may be that climate models are struggling to represent changes in atmospheric circulation patterns that reinforce heat extremes, such as patterns that bring in warm air from the Mediterranean and North Africa–the circulation pattern that was in place during this summer’s deadliest heatwave in late June. Another factor may be related to reductions in air pollution and atmospheric aerosols in recent years. Reductions in aerosols, which reflect solar radiation and have a cooling effect, can lead to increases in warming. Global climate models struggle to represent these microscopic processes, which could be another factor in models underestimating the observed trends.
Ultimately, like all climate risk estimates, Jupiter models rely on global climate model output. When global climate models struggle to capture trends in some regions, such as with European heatwaves, all climate scientists will struggle with predicting record years like 2026. At Jupiter, we are working towards novel advances in extreme event modeling and machine learning that aim to improve representation of underestimated extremes like European heatwaves.
While 2026 has been hot for North America, extreme heat was more localized. For the contiguous United States, summer 2026 was the hottest ever, and for much of the lower 48, winter and spring months also set temperature records. For Canada, 2026 has been hot, but a cooler summer for the Arctic will likely mean 2024 remains Canada’s hottest year ever. Still, much of the United States and Canada suffered from extreme heat this year, including a record-destroying March heatwave, and a July heatwave that put nearly 70 million people (over 20% of the US population) under a heat advisory at the same time. And just like in Europe, the extreme heat amplified drought and wildfire risk. Ontario had its worst-ever wildfire season. In the United States, 2026 burned more acres through October than any year in the past 10, and the hot, dry conditions throughout the Mountain West have led to well below average water levels at key reservoirs such as Lake Mead.
Despite the summer heat, observed heat did not exceed the Jupiter heat model’s predictions for most regions. The South, Southeast, and Plains regions experienced the most extreme heat on a regional level, with the Plains and South regions experiencing more hot days than predicted by Jupiter’s model, and the South and Southeast regions experiencing more heatwave days than Jupiter’s model predicted. The Southwest region was also notably hot, though the observed heatwave days fell within the upper bound of the Jupiter heat model’s predictions.
Why have climate models struggled to predict recent temperature trends in some regions?
Extreme heat has risen rapidly, even in just the last two decades. In Canada, nearly two-thirds of all heat-related deaths have occurred in the last decade. Heat-related healthcare costs associated with extreme heat have soared in the United States, increasing 71% since 2012. And this summer, Europe experienced heatwaves that would have been virtually impossible 50 years ago, and 10 times less likely just 20 years ago. Early season heatwaves that were 1-in-50 year events a few decades ago have now become 1-in-5 year events, and peak season heatwaves are 2°C (3.6°F) hotter than they would have been in the early 2000s.
For many locations, the hottest temperatures have been rising much faster than more moderate temperatures. That is, the right tail risk of extreme heat is widening–and it’s growing much faster than climate models have predicted for some regions. And the gap is widening the fastest for western Europe, where the hottest days are warming twice as fast as an average day.
These discrepancies in global climate models may be a result of several different factors. Scientists suspect that changes in atmospheric circulation patterns could be helping to accelerate warming trends in some areas. Once on the ground, the hotter, drier air sucks moisture out of the soil, further amplifying extreme heat–such as during the 2021 North American heatwave. When multiple extreme heat events occur in different locations at the same time, they can strengthen each other, creating yet another amplifying feedback. And the warmer it gets, the more these effects compound, thus furthering the accelerated warming. Scientists suspect that global climate models have underestimated the intensity of these changes in the atmospheric circulation, leading to an underestimation of recent regional warming trends.
Ultimately, the Jupiter heat model is based on global climate model predictions. While the climate model predictions are calibrated and bias-corrected by reanalysis, and downscaled using weather station observations, they are still fundamentally anchored by the GCM predictions. When the global climate models are systematically underestimating temperatures and temperature trends in a given region all climate projections, including Jupiter’s, will struggle to capture observed heat. Areas where Jupiter’s heat model has underestimated heat extremes in recent years–western Europe; hot, dry regions like Northern Africa and Central Asia; and mountainous terrain such as the Alps or other mountain ranges–are the same areas where global climate models have systematically struggled to capture the observed temperatures of the last decade or two.
The good news is that a new generation of climate models is approaching. This next generation of climate models will have an updated historical baseline that includes 2015 through 2023 in historical simulations. This means that many of the observed trends in extreme heat will be included in the historical period. While these climate models are still many months away from being ready for decision-grade analytics, the longer historical period coupled with improvements in physical modeling, data assimilation, and machine learning models all point towards improvements for extreme heat.
References
- Lancet Countdown, 2026: 2026 Report. Lancet Countdown.
- Hundessa, S., et al., 2025: Global excess deaths associated with heatwaves in 2023 and the contribution of human-induced climate change.The Innovation, 6, 101110.
- Oka, K., 2026: Heatstroke in Japan: current status, future risks, and prevention measures under a changing climate. Climate Risk Management, 54, 100887.
- Narang, P. and A. Gadgil, 2026: Estimating heatwave-induced excess mortality in India's districts. Front. Environ. Health 5, 1789071.
- Auang, H.W., et al., 2026: Heat-related health impacts in ASEAN countries: A scoping review. Environmental and Sustainability Indicators, 30, 101272.
- Howard JT, Androne N, Alcover KC, Santos-Lozada AR, 2024: Trends of Heat-Related Deaths in the US, 1999-2023. JAMA. 2024;332(14):1203–1204.
- Sutinen, Jessica, and Victor Gallant. 2025. Heat-Related Morbidity and Mortality in Canada. Ottawa, ON: Health Canada.
- Brown, S.E., and V.S. Shandas, 2026: Predicting Urban Heat‐Related Illness Across U.S. Climate Regions and Demographics. GeoHealth, 10, e2025GH001655.
- National Center for Environmental Health (U.S.). Environmental Health Tracking Branch. 2022. CDC's Heat & Health Tracker: A Tool That Provides Community-Level Information on Heat Risk. Atlanta, GA: Centers for Disease Control and Prevention.
- Lancet Countdown, 2025: 2025 Report. Lancet Countdown.
- Matthews, T., Raymond, C., Foster, J. et al., 2025: Mortality impacts of the most extreme heat events. Nat Rev Earth Environ 6, 193–210.
- Barnes, C., P. Masselot, D. Xi, et al., 2026: Heat-related urban mortality attributable to human-induced climate change in Europe in summer 2026. Grantham Institute.
- Zittis, G., Alberti, T., Almazroui, M. et al., 2025: Analysis of the 2024 Hajj heat event and future temperature extremes in Mecca. npj Nat. Hazards 2, 107.
- Monteiro dos Santos, D., et al., 2024: Twenty-first-century demographic and social inequalities of heat-related deaths in Brazilian urban areas. PLOS One, 19, e0295766.
- Huynen, M. M. T. E., & Martens, P., 2015: Climate Change Effects on Heat- and Cold-Related Mortality in the Netherlands: A Scenario-Based Integrated Environmental Health Impact Assessment. International Journal of Environmental Research and Public Health, 12(10), 13295-13320.
- Ostro, B., Barrera-Gómez, J., Ballester, J. et al., 2021: The impact of future summer temperature on public health in Barcelona and Catalonia, Spain. Int J Biometeorol 56, 1135–1144.
- Cole, R., K. Wan, et al., 2025: Projections of heat related mortality under combined climate and socioeconomic adaptation scenarios for England and Wales. PLOS Climate, 4: e0000553.
- Pal, J.S., and E.A.B. Eltahir, 2016: Future temperature in southwest Asia projected to exceed a threshold for human adaptability. Nature Climate Change, 6, 197 - 200.
- Saeed, F., C.-F. Schleussner, and M. Ashfaq, 2021: Deadly Heat Stress to Become Commonplace Across South Asia Already at 1.5°C of Global Warming. Geophys. Res. Lett., 48, e2020GL091191.
- Center for American Progress, 27 June 2023: The Health Care Costs of Extreme Heat. Center for American Progress.
- García-León D, Masselot P, Mistry M et al., 2024: Temperature-related mortality burden and projected change in 1368 European regions: a modelling study. The Lancet Public Health, 9, e644-e653.
- Wilson, A.J., R.D. Bressler, et al., 2024: Heat disproportionately kills young people: Evidence from wet-bulb temperature in Mexico. Sci. Advances, 10, 3367.
- Clark, J., B. Weintraut, et al., 2025: Counting the Cost: Quantifying the Rising Impacts of Heat-Related Productivity Losses in the United States (2001–2023). Nicholas Institute for Energy, Environment, and Sustainability, Duke University.
- Lancet Countdown, October 2025: Lancet Countdown on Health and Climate Change: Data Sheet 2025 – Japan. Lancet Countdown.
- Kim, K., 13 July 2026: 'Too hot to work': Extreme heat costs South Korea W28tr a year. The Herald Business.
- Emirati Perspectives and Insight Centre, October 2026: Extreme heat: Adaptation in Gulf cities. Policy Paper No. EPIC-PP-2026-031.
- El Mir, J., 2025: Heat Resilience: A Matter of Both Adaptation and Mitigation for the GCC. In: Arora, A., Belaïd, F., Lechtenberg-Kasten, S. (eds) Climate-Resilient Cities. Contributions to Economics. Springer, Cham.
- Kjellstrom, T., et al., 2019: Working on a warmer planet: The impact of heat stress on labour productivity and decent work. International Labour Organization.
- Wertz, J., 30 Jun 2025: London Tube Carriages Can Be 5C Hotter Than Street in Heat Wave. Bloomberg.
- Beugin, D., et al., 2023: The Case for Adapting to Extreme Heat: Costs of the 2021 B.C. Heat Wave. Canadian Climate Institute, June 2023.
- Cybersecurity & Infrastructure Security Agency: Extreme Heat. U.S. Department of Homeland Security. Accessed October 2026.
- Yanatama, S., 16 July 2026: Europe's energy use for cooling doubled in six years: Which countries use the most? Euronews.
- A half-century of climate change in major agricultural regions: Trends, impacts, and surprises | PNAS
- Katanich, D., 19 June 2026: Extreme heat in Europe: Which countries face the biggest costs?. Euronews.
- World Bank, 2025: Unlivable: Confronting Extreme Urban Heat in Latin America and the Caribbean. World Bank, Washington DC.
- Dueñas, J., A. Goytia, and B. Hoffmann, 2026: The effect of extreme heat on economic growth: Evidence from Latin America. J. Environ. Econ. Management, 135, 103241.
- Martinez-Villalobos, C., Fu, D., Loikith, P.C. et al., 2025: Accelerating increase in the duration of heatwaves under global warming. Nat. Geosci. 18, 716–723.
- Baldwin, J.W., J.B. Dessy, G.A. Vecchi, and M. Oppenheimer, 2019: Temporally Compound Heat Wave Events and Global Warming: An Emerging Hazard. Earth’s Future, 7, 411-427.
- European Environment Agency, & European Foundation for the Improvement of Living and Working Conditions, 4 February 2026: Overheated and underprepared – Europeans’ experience of living with climate change. EEA Report No. 01/2026.
- Buzan, J. R., Oleson, K., and Huber, M., 2015: Implementation and comparison of a suite of heat stress metrics within the Community Land Model version 4.5. Geosci. Model Dev., 8, 151–170.
- Dehghan, H., S.B. Mortazavi, et al., 2012: Evaluation of wet bulb globe temperature index for estimation of heat strain in hot/humid conditions in the Persian Gulf. J. Res. Med. Sci., 17, 1108-1113.
- Willett, K.M., and S. Sherwood, 2010: Exceedance of heat index thresholds for 15 regions under a warming climate using the wet‐bulb globe temperature. Int. J. Climatology, 32, 161-177.
- Hersbach H., B. Bell, P. Berrisford, et al., 2020: The ERA5 global reanalysis. Q. J. R. Meteorol. Soc., 146: 1999–2049.
- Marcel Buchhorn, et al., 2019: “Copernicus Global Land Service: Land Cover 100m: Collection 2: Epoch 2015: Globe”. Version V2.0.2, Zenodo, 1 Oct. 2019, ESA Living Planet Symposium 2019 (LPS2019), Milan, Italy.
- Menne, Matthew J., et al., 2012: Global Historical Climatology Network - Daily (GHCN-Daily), Version 3. NOAA National Climatic Data Center.
- Smith, A., N. Lott, and R. Vose, 2011: The integrated surface database: Recent developments and partnerships. Bull. Amer. Meteorol. Soc., 92, 704-708.
- Japan Meteorological Agency. Automated Meteorological Data Acquisition System, wind speed observations. Accessed via Japan Meteorological Agency.
- Trinidad, P. (2026). BioclimaMX Stations: Mexican Climate Station Records (CONAGUA), Augmented with NASA POWER (Version 0.1) [Dataset]. Zenodo.
- Daly, C., et al., 2008: Physiographically sensitive mapping of climatological temperature and precipitation across the conterminous United States. Int. J. Climatol., 28: 2031-2064.
- Fick, S.E. and Hijmans, R.J., 2017: WorldClim 2: new 1-km spatial resolution climate surfaces for global land areas. Int. J. Climatol, 37: 4302-4315.
- Thornton, M.M., R. Shrestha, Y. Wei, P.E. Thornton, and S-C. Kao, 2020: Daymet: Annual Climate Summaries on a 1-km Grid for North America, Version 4. ORNL DAAC, Oak Ridge, Tennessee, USA.
- Foster, G., and S. Rahmstorf, 2026: Global Warming Has Accelerated Significantly. Geophys. Res. Lett., 53, e2025GL118804.
- K. Kornhuber, S. Bartusek, R. Seager, H.J. Schellnhuber, and M. Ting, 2024: Global emergence of regional heatwave hotspots outpaces climate model simulations. Proc. Natl. Acad. Sci. U.S.A., 121 (49), e2411258121.
- Liu, Z., W. Zhan, et al., 2022: Surface warming in global cities is substantially more rapid than in rural background areas. Communications Earth and Environment, 3, 219.
- United Nations, Department of Economic and Social Affairs, Population Division, 2025: World Urbanization Prospects 2025. United Nations. Accessed October 27, 2026.
- Simpson, I.R., K.A. McKinnon, et al., 2023: Observed humidity trends in dry regions contradict climate models. Proc. Nat. Acad. Sci., 121, e2302480120.
- Ault, T.R., 2020: On the essentials of drought in a changing climate. Science, 368, 256-60.
- Poitras, A.: Extreme heat waves in Québec. ClimateData.ca. Accessed October 2026.
- Duan, L., Freese, L.M., Bala, G. et al., 2025: Historical model biases in monthly high temperature anomalies indicate under-estimation of future temperature extremes. Commun Earth Environ 6, 604.
- Bartusek, S., K. Kornhuber, and M. Ting, 2022: 2021 North American heatwave amplified by climate change-driven nonlinear interactions. Nat. Clim. Chang., 12, 1143 - 1150.
- Burt, S., 2025: Evaluation and verification of new UK air temperature extremes during the July 2022 heatwave. Part 1: maximum temperatures. Weather, 80, 220 - 228.
- Adhikari, P., B. Geerst, et al., 2024: Evaluation of the Mountain Hydroclimate across the Western United States in Dynamically Downscaled Climate Models. J. Hydrometeorology, 25, 1877 - 1894.
- Copernicus Climate Change Service, 10 September 2026: August was the world's joint hottest month on record, pushing global temperatures back above 1.5°C above pre-industrial levels. European Centre for Medium-Range Weather Forecasts.
- EU Space Support Office, 5 August 2026: Europe's major rivers at record low water levels. EU Space Policy, European Commission.
- Crellin, F., and S. Twidale, 31 July 2026: As Europe heats up, summer power prices match winter peaks. Reuters.
- National Centers for Environmental Information, 9 September 2026: Monitoring the U.S. temperature and precipitation in August 2026. National Oceanic and Atmospheric Administration.
- National Interagency Fire Center. 23 October 2026. National fire news. U.S. Department of the Interior. Accessed 23 October 2026.
- Keeping, T., Barnes, C., Clarke, B., et al., 2026: Fossil fuel emissions have rapidly worsened European heatwaves in just a few decades. World Weather Attribution.
- Clarke, B., C. Bergin, C. Barnes, et al., 2025: Climate change turns warm summer days in England into health threat. World Weather Attribution.
- Patterson, M., 2023: North‐West Europe Hottest Days Are Warming Twice as Fast as Mean Summer Days. Geophys. Res. Lett., 50, e2023GL102757.
- Vautard, R., Cattiaux, J., et al., 2023: Heat extremes in Western Europe increasing faster than simulated due to atmospheric circulation trends. Nat. Commun., 14, 6803.
- Nasong, D., S. Zhou, K. Kornhuber, and B. Yu, 2025: Concurrent Heat Extremes in Relation to Global Warming, High Atmospheric Pressure and Low Soil Moisture in the Northern Hemisphere. Earth’s Future, 13, e2024EF005256.
- Feranda, D., G. Messori, et. al., 2023: Atmospheric circulation compounds anthropogenic warming and impacts of climate extremes in Europe. Proc. Nat. Acad. Sci. U.S.A., 120 (13), e2214525120.
- Davini, P., and F. D’Andrea, 2020: From CMIP3 to CMIP6: Northern Hemisphere Atmospheric Blocking Simulation in Present and Future Climate. J. Climate, 33, 10021 - 10038.
- Jupiter Intelligence, 12 June 2026: CMIP7 Is Here: What's Changed, What It Means. Accessed October 2026.
Data Sources
- Buzan, J. R., Oleson, K., and Huber, M., 2015: Implementation and comparison of a suite of heat stress metrics within the Community Land Model version 4.5. Geosci. Model Dev., 8, 151–170.
- Dehghan, H., S.B. Mortazavi, et al., 2012: Evaluation of wet bulb globe temperature index for estimation of heat strain in hot/humid conditions in the Persian Gulf. J. Res. Med. Sci., 17, 1108-1113.
- Willett, K.M., and S. Sherwood, 2010: Exceedance of heat index thresholds for 15 regions under a warming climate using the wet‐bulb globe temperature. Int. J. Climatology, 32, 161-177.
- Hersbach H., B. Bell, P. Berrisford, et al., 2020: The ERA5 global reanalysis. Q. J. R. Meteorol. Soc., 146: 1999–2049.
- Marcel Buchhorn, et al., 2019: “Copernicus Global Land Service: Land Cover 100m: Collection 2: Epoch 2015: Globe”. Version V2.0.2, Zenodo, 1 Oct. 2019, ESA Living Planet Symposium 2019 (LPS2019), Milan, Italy.
- Menne, Matthew J., et al., 2012: Global Historical Climatology Network - Daily (GHCN-Daily), Version 3. NOAA National Climatic Data Center.
- Smith, A., N. Lott, and R. Vose, 2011: The integrated surface database: Recent developments and partnerships. Bull. Amer. Meteorol. Soc., 92, 704-708.
- Japan Meteorological Agency. Automated Meteorological Data Acquisition System, wind speed observations. Accessed via Japan Meteorological Agency.
- Trinidad, P. (2026). BioclimaMX Stations: Mexican Climate Station Records (CONAGUA), Augmented with NASA POWER (Version 0.1) [Dataset]. Zenodo.
- Daly, C., et al., 2008: Physiographically sensitive mapping of climatological temperature and precipitation across the conterminous United States. Int. J. Climatol., 28: 2031-2064.
- Fick, S.E. and Hijmans, R.J., 2017: WorldClim 2: new 1-km spatial resolution climate surfaces for global land areas. Int. J. Climatol, 37: 4302-4315.
- Thornton, M.M., R. Shrestha, Y. Wei, P.E. Thornton, and S-C. Kao, 2020: Daymet: Annual Climate Summaries on a 1-km Grid for North America, Version 4. ORNL DAAC, Oak Ridge, Tennessee, USA.
