.webp)

The seventh phase of the Coupled Model Intercomparison Project (CMIP7) is underway. For climate scientists, it represents years of coordinated effort to improve how the global modeling community simulates Earth's future. For climate risk practitioners, it raises an immediate and practical question: should we be updating our risk assessments right now?
The short answer is no. And understanding why requires a clear-eyed look at what CMIP7 actually changes, what those changes imply for uncertainty, and what it takes to translate new science into decision-ready risk metrics.
A Brief History: From RCPs to SSPs to Emission Trajectories
To appreciate what's new in CMIP7, it helps to trace the most recent lineage of climate scenario design.
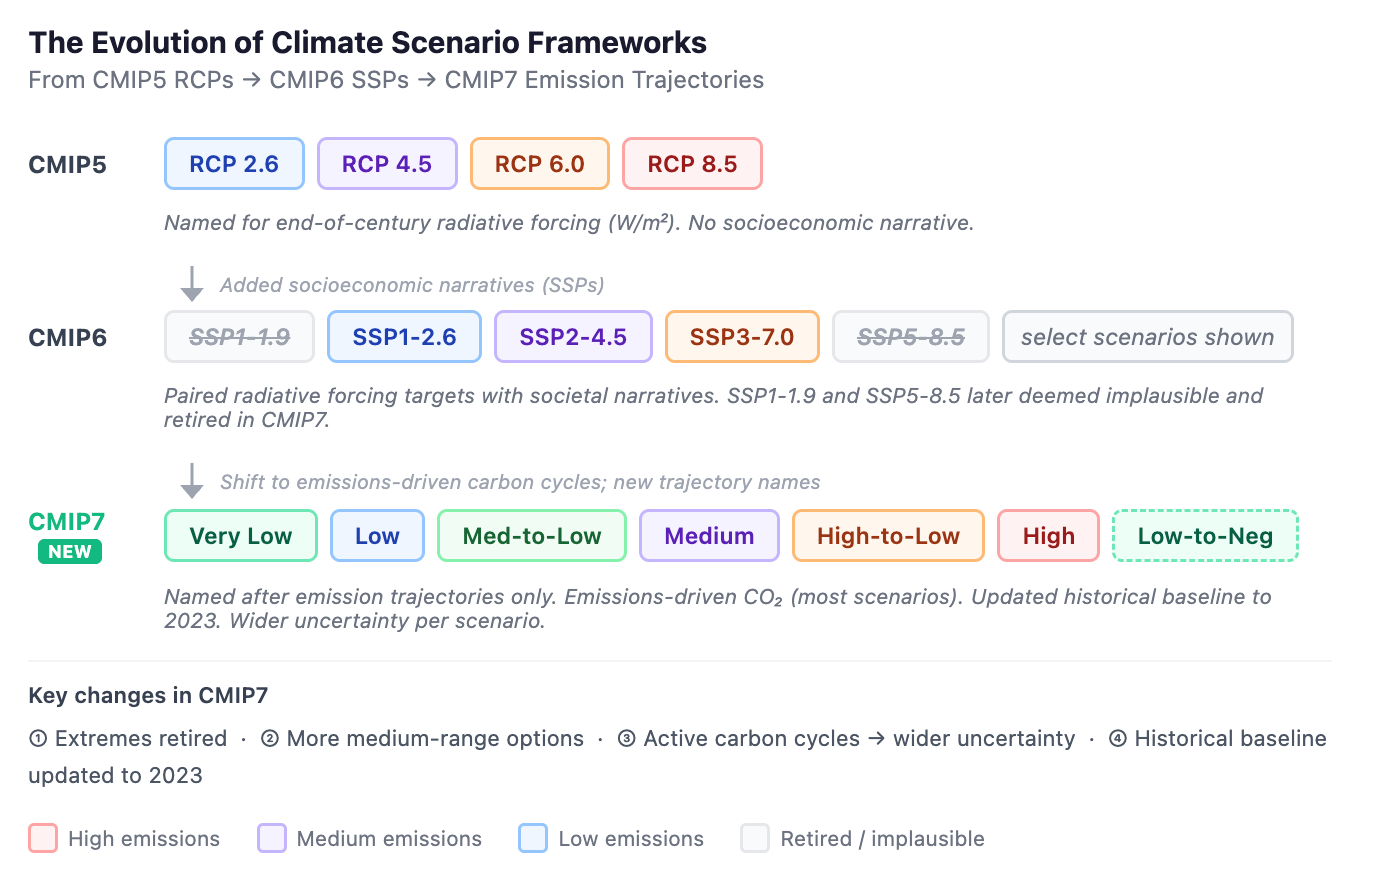
CMIP5 organized its simulations around Representative Concentration Pathways (RCPs) - four scenarios named for their end-of-century radiative forcing levels (RCP2.6, RCP4.5, RCP6.0, and RCP8.5). These were straightforward forcing constructs, but they lacked connection to any broader narrative about how humanity might arrive at a given emissions level.
CMIP6 addressed that gap by pairing radiative forcing levels with Shared Socioeconomic Pathways (SSPs). For the first time, scenarios were tied to quantitative narratives about economic development, inequality, technology adoption, and governance. SSP1-1.9 described a world of aggressive mitigation and sustainability while SSP5-8.5 described one of fossil-fuel-dominated growth. This gave risk analysts a richer vocabulary for discussing why a future might unfold as it does - not just what the forcing levels might be.
CMIP7 takes a different turn. Rather than building upon the SSP framework directly and designing for comparability with CMIP6, the new scenarios are named simply after their emission trajectories: High, High-to-Low, Medium, Medium-to-Low, Low, Very Low, and Low-to-Negative. There was no deliberate design choice to make these scenarios map cleanly onto their CMIP6 predecessors - a notable departure from the CMIP5-to-CMIP6 transition, where scenario alignment was an explicit goal.
The Key Changes in CMIP7
Scenario Range: Narrower at the Extremes, Richer in the Middle
CMIP7 has effectively retired the two most extreme CMIP6 scenarios. SSP5-8.5, which required a roughly fivefold increase in coal consumption beyond any credible estimate of remaining reserves, was widely criticized as an implausible emissions pathway – even if its high-end warming outcomes remained scientifically instructive. SSP1-1.9, representing near-immediate aggressive decarbonization, was similarly judged implausible given current global policy trajectories (Hausfather & Peters, 2020).
In their place, CMIP7 expands the medium-range options, offering more nuance in the space where real-world outcomes are most likely to cluster. The new framework provides more granularity around warming levels seen in SSP2-4.5 or SSP3-7.0, though that granularity comes without a clean crosswalk to the old scenario names.
Emissions-Driven, Not Concentration-Driven
This is the most consequential methodological change in CMIP7, and it has significant implications for uncertainty.
In CMIP5 and CMIP6, most models ran concentration-driven simulations: modelers prescribed the atmospheric concentration of CO₂ directly, ensuring consistency across different global climate models (GCMs). The climate response varied between models; the carbon cycle did not.
CMIP7 flips this. Most scenarios will be emissions-driven, meaning Earth System Models (ESMs) use their own internal carbon cycle modules to compute how atmospheric CO₂ concentrations evolve from a given emissions pathway. The result is a more physically realistic representation of the feedback loops between climate, vegetation, soils, and ocean carbon uptake - but it also means that even given the same emissions trajectory, different models will produce different atmospheric concentrations and therefore a broader range of warming outcomes.
The practical consequence: the uncertainty envelope around each scenario will widen. More modest scenarios could, under certain carbon cycle configurations, produce warming levels previously associated only with high-emissions pathways. Conversely, some models may show less warming than expected. The scenario label alone will convey even less information about impact magnitude than it did under CMIP6.
This is not a flaw in CMIP7 - it is a more honest representation of scientific uncertainty. But it strongly reinforces the case for risk analysis approaches that draw from the full distribution of model outputs rather than anchoring on a single scenario or a central estimate. (See our companion post: The Scenario Trap: Why Climate Risk Analysis Can't Afford to Pick a Lane.)
Updated Historical Baseline
CMIP7 updates its historical emissions baseline from 2015 (CMIP6) to 2023, integrating real-world data from the COVID-19 pandemic period and recent shifts in natural gas usage. For risk analysts, this means the simulation starting points are better calibrated to observed climate states - a meaningful improvement for near-term projections and for connecting model output to current conditions on the ground.
The RCP8.5 Debate: A Note on What "Implausible" Really Means
The retirement of SSP5-8.5 has generated considerable discussion, and it is worth being precise about what the scientific community actually concluded.
The scenario was criticized primarily for its emissions pathway - specifically, its reliance on levels of coal consumption that exceed credible estimates of global reserves. The criticism was about the emissions trajectory, not about the warming outcomes the scenario produced. As Hausfather and Peters (2020) argued, calling SSP5-8.5 "business as usual" was always a mischaracterization; it was designed as a stress test of a high-emissions world, not a forecast.
Here is where the addition of carbon cycle feedbacks in CMIP7 matters most. Because models now run active carbon cycles, it is possible that some CMIP7 simulations under more moderate emissions scenarios will produce warming outcomes that rival or exceed what SSP5-8.5 generated - because carbon cycle feedbacks can amplify the warming signal. The warming magnitudes that made SSP5-8.5 alarming have probably not gone away; they have simply been redistributed across a wider range of scenarios.
For risk practitioners, this should not be read as reassuring news. It is yet another reason why impact-focused risk analysis cannot afford to take scenario labels at face value.
Why CMIP7 Is Not Yet Decision-Ready
CMIP7 models are still running. The broader scientific community is only beginning to characterize how different GCMs respond to the new scenario designs, and the downscaled regional products that underpin localized physical risk analysis do not yet exist at meaningful scale.
Translating GCM output into decision-grade risk metrics requires multiple additional steps: bias correction, statistical or dynamical downscaling, and validation against observed data at the resolution that matters to infrastructure, real estate, and supply chain decisions. Each step introduces assumptions that need rigorous evaluation. Moving prematurely to CMIP7 output – before this pipeline has been built and validated – would trade novelty for accuracy.
The history of CMIP transitions suggests a realistic timeline: it typically takes several years after a new CMIP generation is released before the community has sufficient GCM output, validated downscaling, and cross-model synthesis to support defensible risk products. For CMIP7, responsible integration into commercial risk analytics will take time, and judgment calls made in 2025 or early 2026 are premature.
What This Means for You
CMIP7 represents genuine scientific progress, particularly in its treatment of carbon cycle feedbacks and its updated historical baseline. But the changes it introduces, such as wider uncertainty ranges, non-comparable scenario names, and emissions-driven model runs, make the case stronger, not weaker, for risk methodologies built on full-distribution approaches rather than scenario selection.
Organizations that have built their climate risk programs around "we use SSP2-4.5" as a singular answer will find that CMIP7 challenges the premise. The appropriate response is not to find a new single scenario to anchor to, but to adopt a framework that treats the full ensemble of outcomes as the input – and communicates risk as the distribution it actually is.
Jupiter's Approach
At Jupiter, we are actively monitoring CMIP7 model outputs and will incorporate them into our products once sufficient GCM runs and data products for bias correction and downscaling are available to do so responsibly. Our current risk metrics are built on CMIP6 output spanning the full range of available scenarios and models – an approach that already accounts for the uncertainty that CMIP7 will make even more explicit.
Interested in how Jupiter stays ahead of the science while keeping risk metrics decision-ready? Talk to our team.
References and Further Reading
- Hausfather, Z., & Peters, G.P. (2020). Emissions — the 'business as usual' story is misleading. Nature, 577, 618–620.
- O'Neill, B.C., et al. (2016). The Scenario Model Intercomparison Project (ScenarioMIP) for CMIP6. Geoscientific Model Development, 9, 3461–3482.
- Eyring, V., et al. (2016). Overview of the Coupled Model Intercomparison Project Phase 6 (CMIP6). Geoscientific Model Development, 9, 1937–1958.
- Riahi, K., et al. (2017). The Shared Socioeconomic Pathways and their energy, land use, and greenhouse gas emissions implications. Global Environmental Change, 42, 153–168.
- IPCC (2021). Climate Change 2021: The Physical Science Basis. Contribution of Working Group I to the Sixth Assessment Report. Cambridge University Press.
- Meinshausen, M., et al. (2020). The shared socio-economic pathway (SSP) greenhouse gas concentrations and their extensions to 2500. Geoscientific Model Development, 13, 3571–3605.
