.webp)
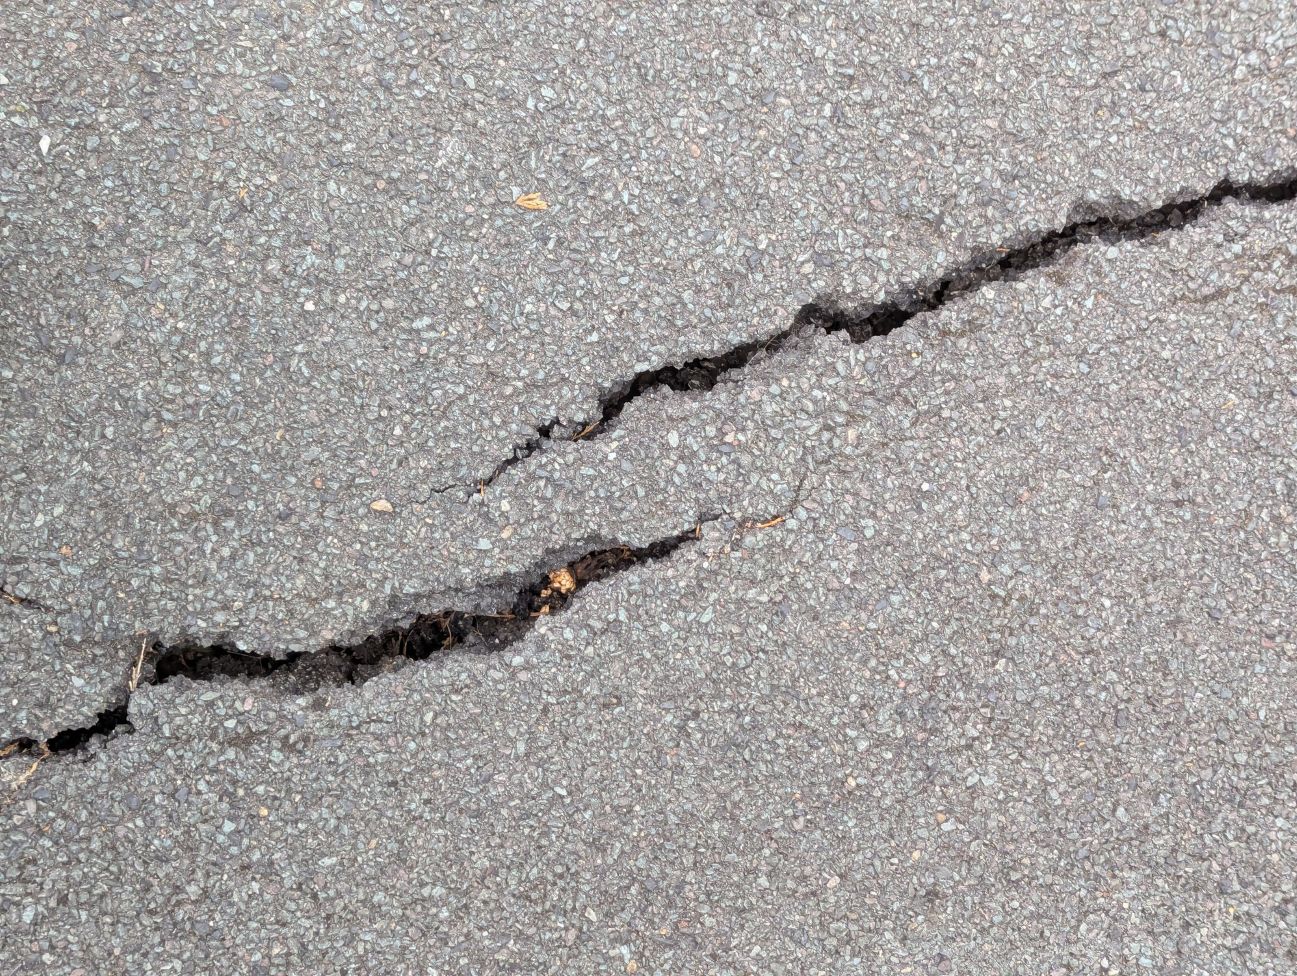
Shrink-swell subsidence in clay-rich soils is a considerable and growing threat to buildings and infrastructure. As the risk of extreme heat and drought grows worldwide, rapid changes in soil moisture can cause extensive structural damage. In high-risk areas, damages due to shrink-swell subsidence are comparable to those due to other physical hazards, like wind and flood. Exceptionally hot, dry summers, such as the past two summers in the United Kingdom, can accelerate the impacts of subsidence and increase subsidence-related insurance claims.
Subsidence: The Growing Hazard Beneath Your Feet
In Western Europe, this summer has been marked by extreme heat and an ongoing drought. The consistent lack of rain has led to exceptionally low water levels in major rivers, such as the Danube and the Rhine. A succession of record-breaking heatwaves led to 16,000 excess deaths in a single week. And the exceptionally hot, dry conditions have allowed massive wildfires to encroach on major cities like Madrid and Bordeaux.
The hot, dry summer has also been marked by crumbling roads, cracked walls and foundations, and increasing insurance payouts. But what do intense droughts and heatwaves have to do with sloped floors, destroyed roads, and cracked walls and foundations? The answer is subsidence. And for countries with clay-rich soils like the United Kingdom, France, and Australia, the threat of subsidence is large, and growing quickly.
Subsidence refers to the downward movement of the height of the Earth’s surface; that is, sinking land. As this land sinks, often unevenly, buildings are damaged, requiring extensive repairs–and occasionally they collapse entirely. Some causes of subsidence, such as abandoned mines, are manmade. But subsidence can have natural causes as well–earthquakes, collapsing limestone or karst caves, or soil shrinking and swelling due to changes in moisture levels. It’s this last type of subsidence–known as shrink-swell subsidence–that has a clear climate signal. As the planet warms and swings between wet and dry conditions become more extreme, shrink-swell subsidence is becoming an increasingly important hazard, especially for places with high amounts of clay in their soil.
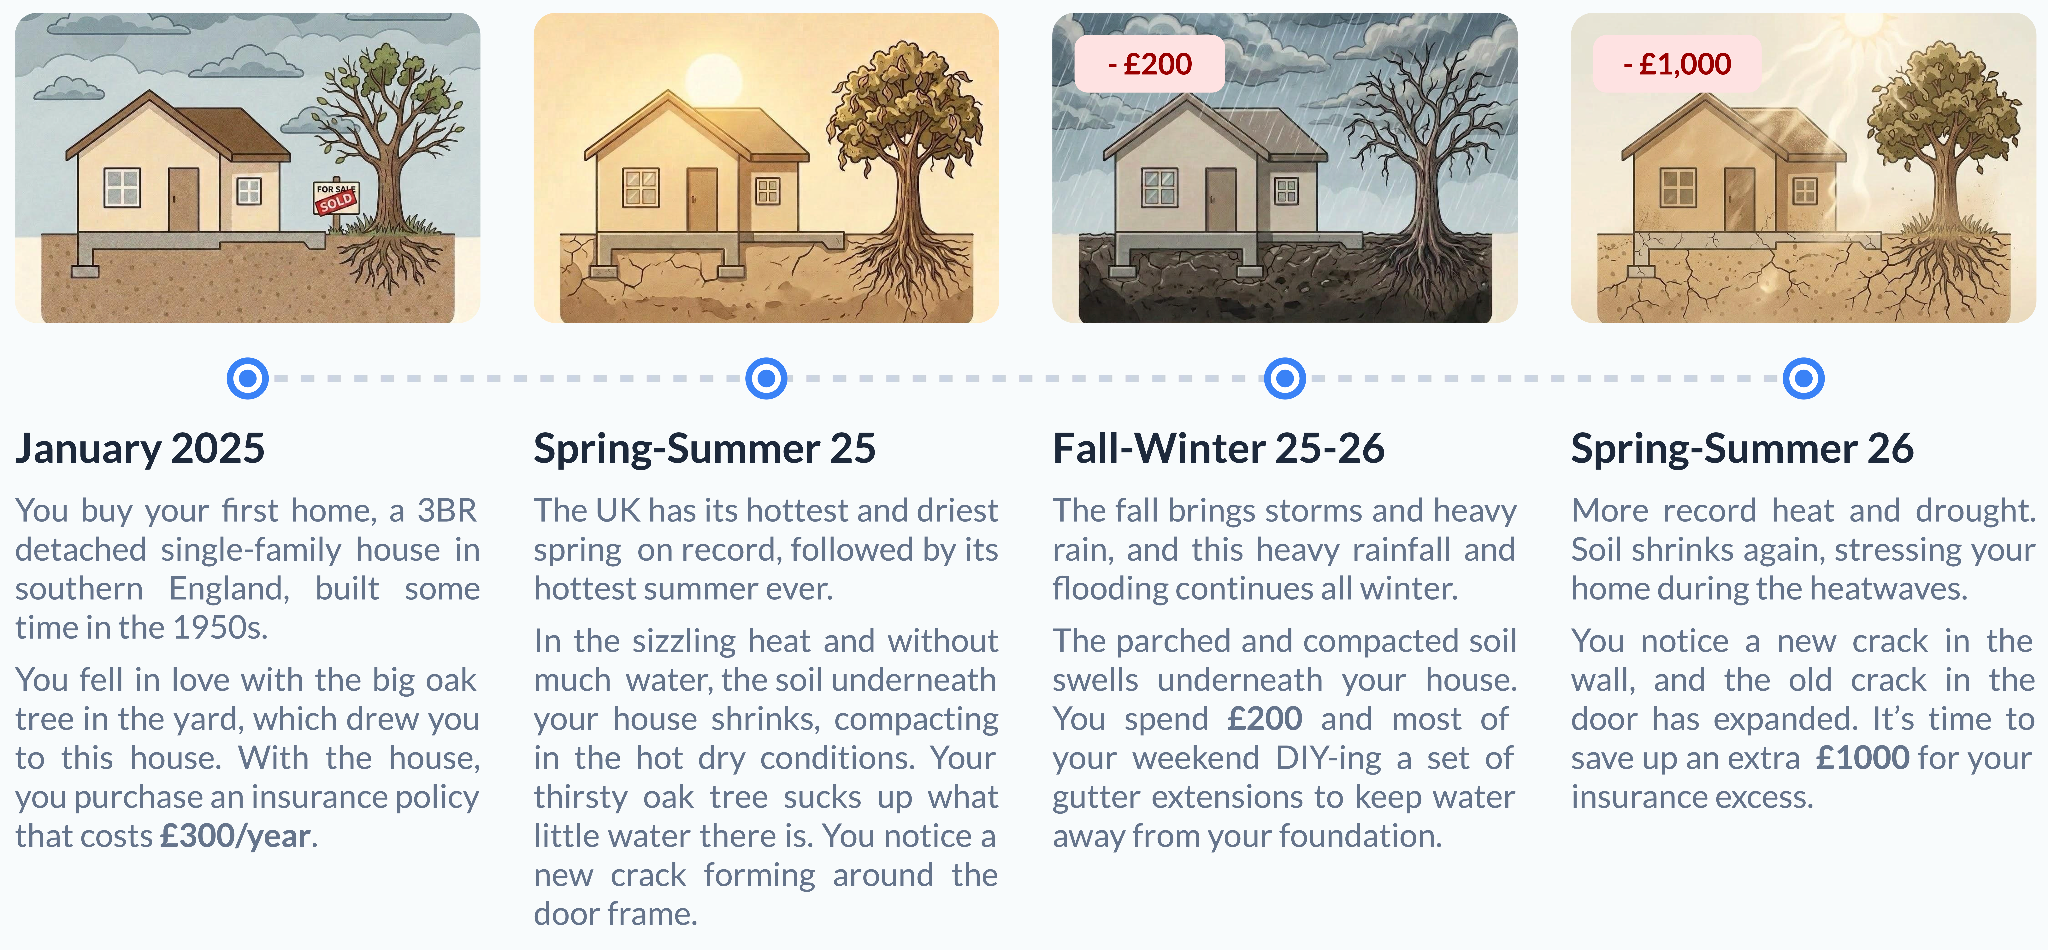
Consider a homeowner in the United Kingdom, which is in the midst of another record-breaking hot, dry summer. During a hot, dry summer, like summer 2025, the heat and lack of moisture result in soil shrinking and compacting. When this shrinking occurs underneath structures, buildings with vulnerable construction, like many U.K. homes, can sink. This eventually leads to structural problems like sloped floors, cracks in the wall, and damaged foundations. During droughts, trees that require a lot of water (like oak trees) can make the problem worse by siphoning off any excess water in the soil for themselves. When the heavy rains of fall and winter roll around, the dry, compacted soil is less able to absorb the moisture, leading to swelling underneath buildings, and excess water pooling on the surface, further increasing the risk of foundation damage. When a wet winter is followed by a hot, dry, spring and summer (as has been the case this year), the soil again shrinks and compacts, further stressing a home. In fact, the Association of British Insurers estimates that through June 2026, the average payout for a subsidence claim is more than £2,000 ($2,725) greater than it was a year ago–and that’s without including the hottest, driest months of July and August.
Ultimately, when the damage gets significant enough, repairs are necessary; and costly mitigation features may be as well. In a single building, the damage caused by subsidence typically costs $10,000 - $50,000, with the most intense foundation repairs costing up to $100,000. In heavily afflicted countries like the United Kingdom, subsidence is responsible for over £400 million ($545 million) in damages every year, making it the country’s second-costliest natural hazard after flooding. In France, subsidence has cost at least €600 million ($700 million) per year since 2016, while in the U.S., annual losses due to subsidence are estimated to be nearly $15 billion. And as drought risk rises in many locales, so too does subsidence risk.
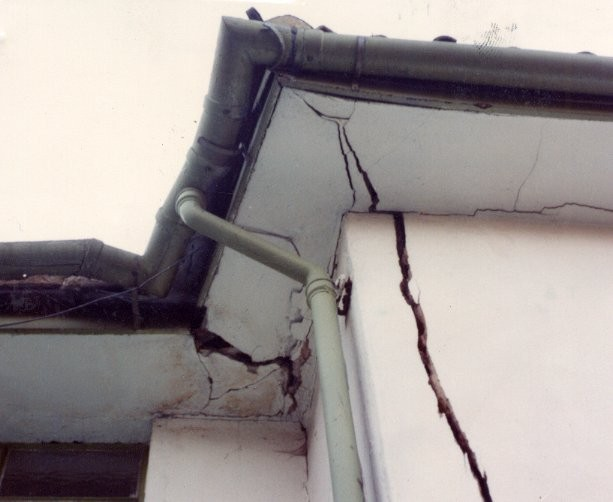
Despite the financial impacts of subsidence, existing subsidence-focused solutions are region-specific, hazard-only, or focused only on current conditions. Recognizing a gap in the market, Jupiter has developed the first quantified, forward-looking asset-level subsidence risk and loss model on the market. Since shrink-swell subsidence is strongly driven by soil moisture and drought, climate model projections allow property owners and asset managers to estimate future risk, not just present exposure.
Drought and Soil in a Changing Climate
Clay shrink–swell subsidence occurs when expansive clay soils repeatedly shrink during periods of drought, and swell again when moisture returns to the soil. The microscopic structure of clay soils means that these soils act like sponges–they swell to absorb water molecules when they are wet, and contract and shrink when conditions are dry. These expansions and contractions can change the soil volume by as much as 10%. The shrink-swell process happens on small scales–soil height changes occur unevenly under buildings, leading to structural damage on the single-building level. Ultimately, this can lead to uneven floors, sloped doors, and cracks in foundations, walls, and roads and infrastructure.
Shrink-swell subsidence depends on three key factors–soil clay content, drought risk, and vegetation. Shrinking and swelling are especially prevalent in the top 2 to 5 meters (6 to 15 feet) of soil, where building and infrastructure foundations are typically built. Regions that have little or no clay in their soils are not at risk from shrink-swell subsidence, while regions with higher levels of clay in their soils do face subsidence risk. Subsidence risk also increases as drought risk increases–longer or more frequent drought episodes raise the risk of “shrink” periods, leading to higher likelihood of asset damage. Certain types of water-loving vegetation, such as oak or willow trees, can further compound the impacts of drought by removing even more moisture from the soil.
And as the climate becomes hotter and drier, many nations face a growing threat from subsidence. In 2025, the UK experienced its hottest spring and summer ever. The months of warm, dry weather resulted in the largest subsidence-related insurance payouts on record, totalling £307 million. A recent study published by the British Geological Survey estimates that even under a low-emissions scenario, 500,000 U.K. properties could be afflicted by subsidence risk in the future, with millions of properties at risk under medium and high-emissions scenarios.
Modeling Subsidence: From Hazard to Impact
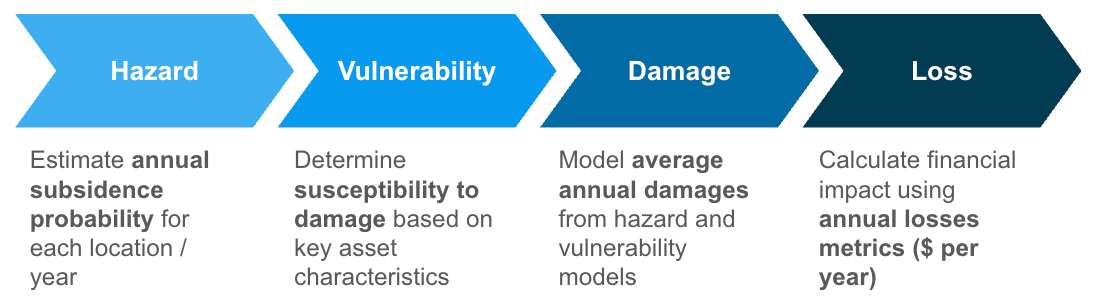
Creating a comprehensive model for subsidence includes four steps:
- Quantifying hazard. First, the physical risk to shrink-swell subsidence must be estimated. Physical risk to subsidence is determined by soil and vegetation characteristics and drought risk. For each location, in each year, the hazard model estimates the annual subsidence probability.
- Assessing exposure and vulnerability. An asset’s exposure and vulnerability to subsidence is determined by asset type and characteristics, such as the age of the building.
- Estimating damages. The hazard, exposure, and vulnerability models are combined to produce an annual average damage estimate for an asset.
- Computing financial losses. Finally, the financial impact is determined using damage estimates and the asset value.
Although subsidence is one of the leading causes of damage in countries like the United Kingdom and France, a standardized, forward-looking, asset-level subsidence loss model had not previously been developed. The Jupiter subsidence model is the first of its kind, providing global physical and financial risk assets for present and future conditions.
Identifying Physical Risk with the Subsidence Hazard Model
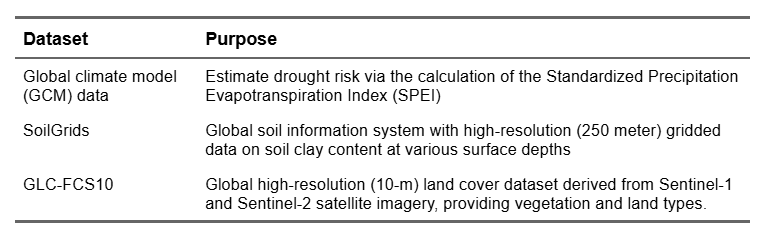
Jupiter’s subsidence physical risk model is built on three key factors: soil clay content, vegetation types, and drought risk. Table 1 lists the external datasets used to create Jupiter’s subsidence hazard model.
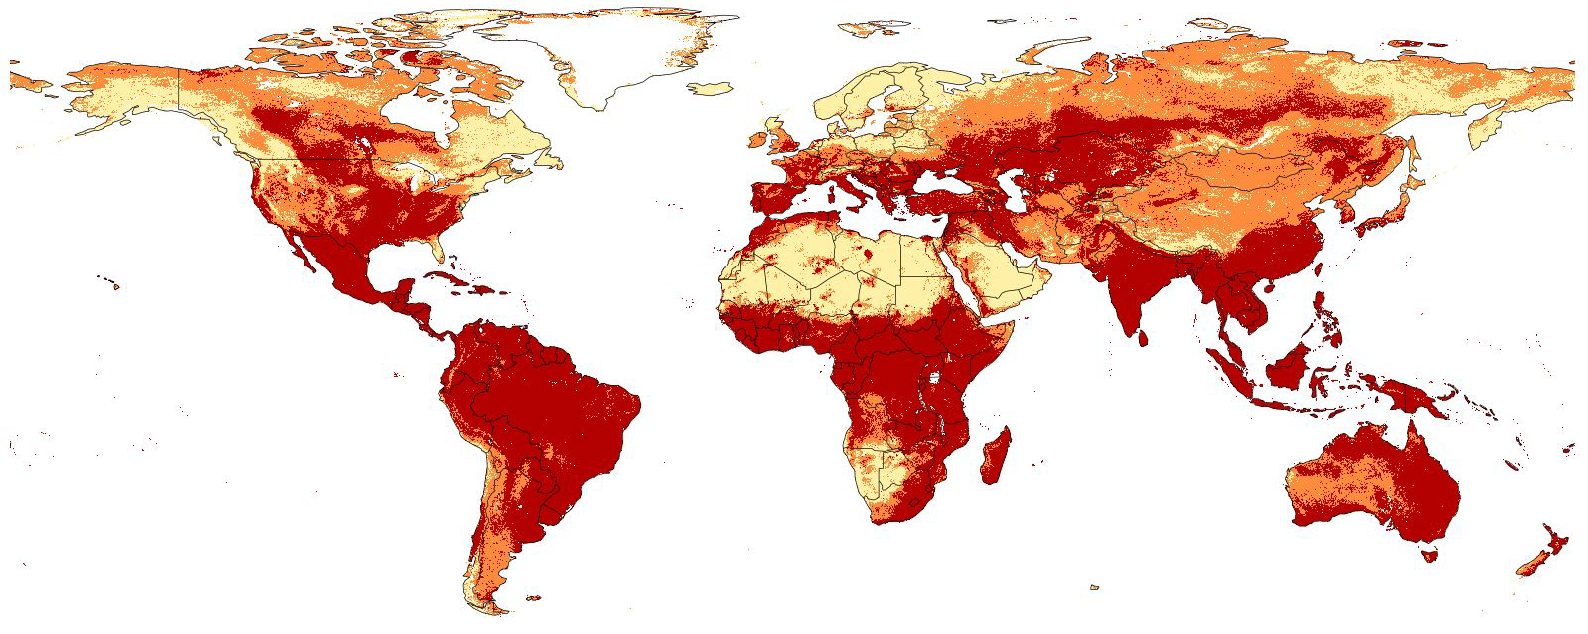
Soil type. The first predictor of subsidence risk is soil type. Regions with moderate to high clay soil content are considered to be at risk for subsidence. Much of the world’s soils have a clay content that exceeds 25%, including large parts of the United States, the United Kingdom, western and southern Europe, Brazil, Australia, Southeast Asia, Indonesia and the Philippines and sub-Saharan Africa.
Drought risk. For regions determined to have sufficient clay soil content, total subsidence risk depends on drought conditions and vegetation types. Drought is estimated using the Standardized Precipitation Evapotranspiration Index (SPEI), which is a drought monitoring index based on precipitation and evapotranspiration. Jupiter’s SPEI calculation accounts for dynamic vegetation feedback, allowing for a greater representation of the role of vegetation in drought risk.
Vegetation type. A region’s vegetation can also impact its subsidence risk. In places with high-water-use trees, like oak, willow, and elm, subsidence risk is even greater. Oak trees are particularly impactful, drawing up water from soil as much as 18 meters (59 feet) from the trunk, further exacerbating soil shrinkage during times of drought and water stress.
After analyzing soil composition, vegetation type, and drought index, the subsidence hazard model ultimately produces an average annual subsidence probability for a specified asset location, for each emissions scenario and year, at a 90 m resolution. As with other Jupiter hazard models, the mean subsidence probability is calculated along with an uncertainty range.
Pricing Subsidence with a New Economic Impact Model
The economic impact model estimates damages and losses using the output of the physical risk model. While the physical risk model relies only on the asset location, the damage and loss model also uses information about the structural characteristics of the asset. Some of these characteristics that the Jupiter damage and loss model considers include building foundation type, building age, the presence or absence of basements, and the building construction type (e.g., brick, timber, masonry).
For each asset, an analysis of the structural characteristics creates a damage score. This damage score is combined with the annual subsidence probability estimates from the hazard model to create damage estimates for each asset. We note that the highest subsidence risk occurs for assets that are both structurally vulnerable and exposed (based on building characteristics), as well as physically at risk (based on the hazard model). The financial loss model uses the damage model and the asset value to provide a final financial loss estimate for subsidence.
Jupiter’s Subsidence Model Shows the Growth of Subsidence Risk
The Jupiter subsidence model fills a gap in physical risk modeling. While some subsidence risk assessments exist, these are regional, focus only on the physical hazard, or only estimate present-day. The Jupiter subsidence model provides a standardized approach to quantify asset-level subsidence risk and loss. And Jupiter’s climate projections provide future risk estimates across a variety of emissions scenarios, not just in today's climate.
The Growing Subsidence Risk in the United Kingdom
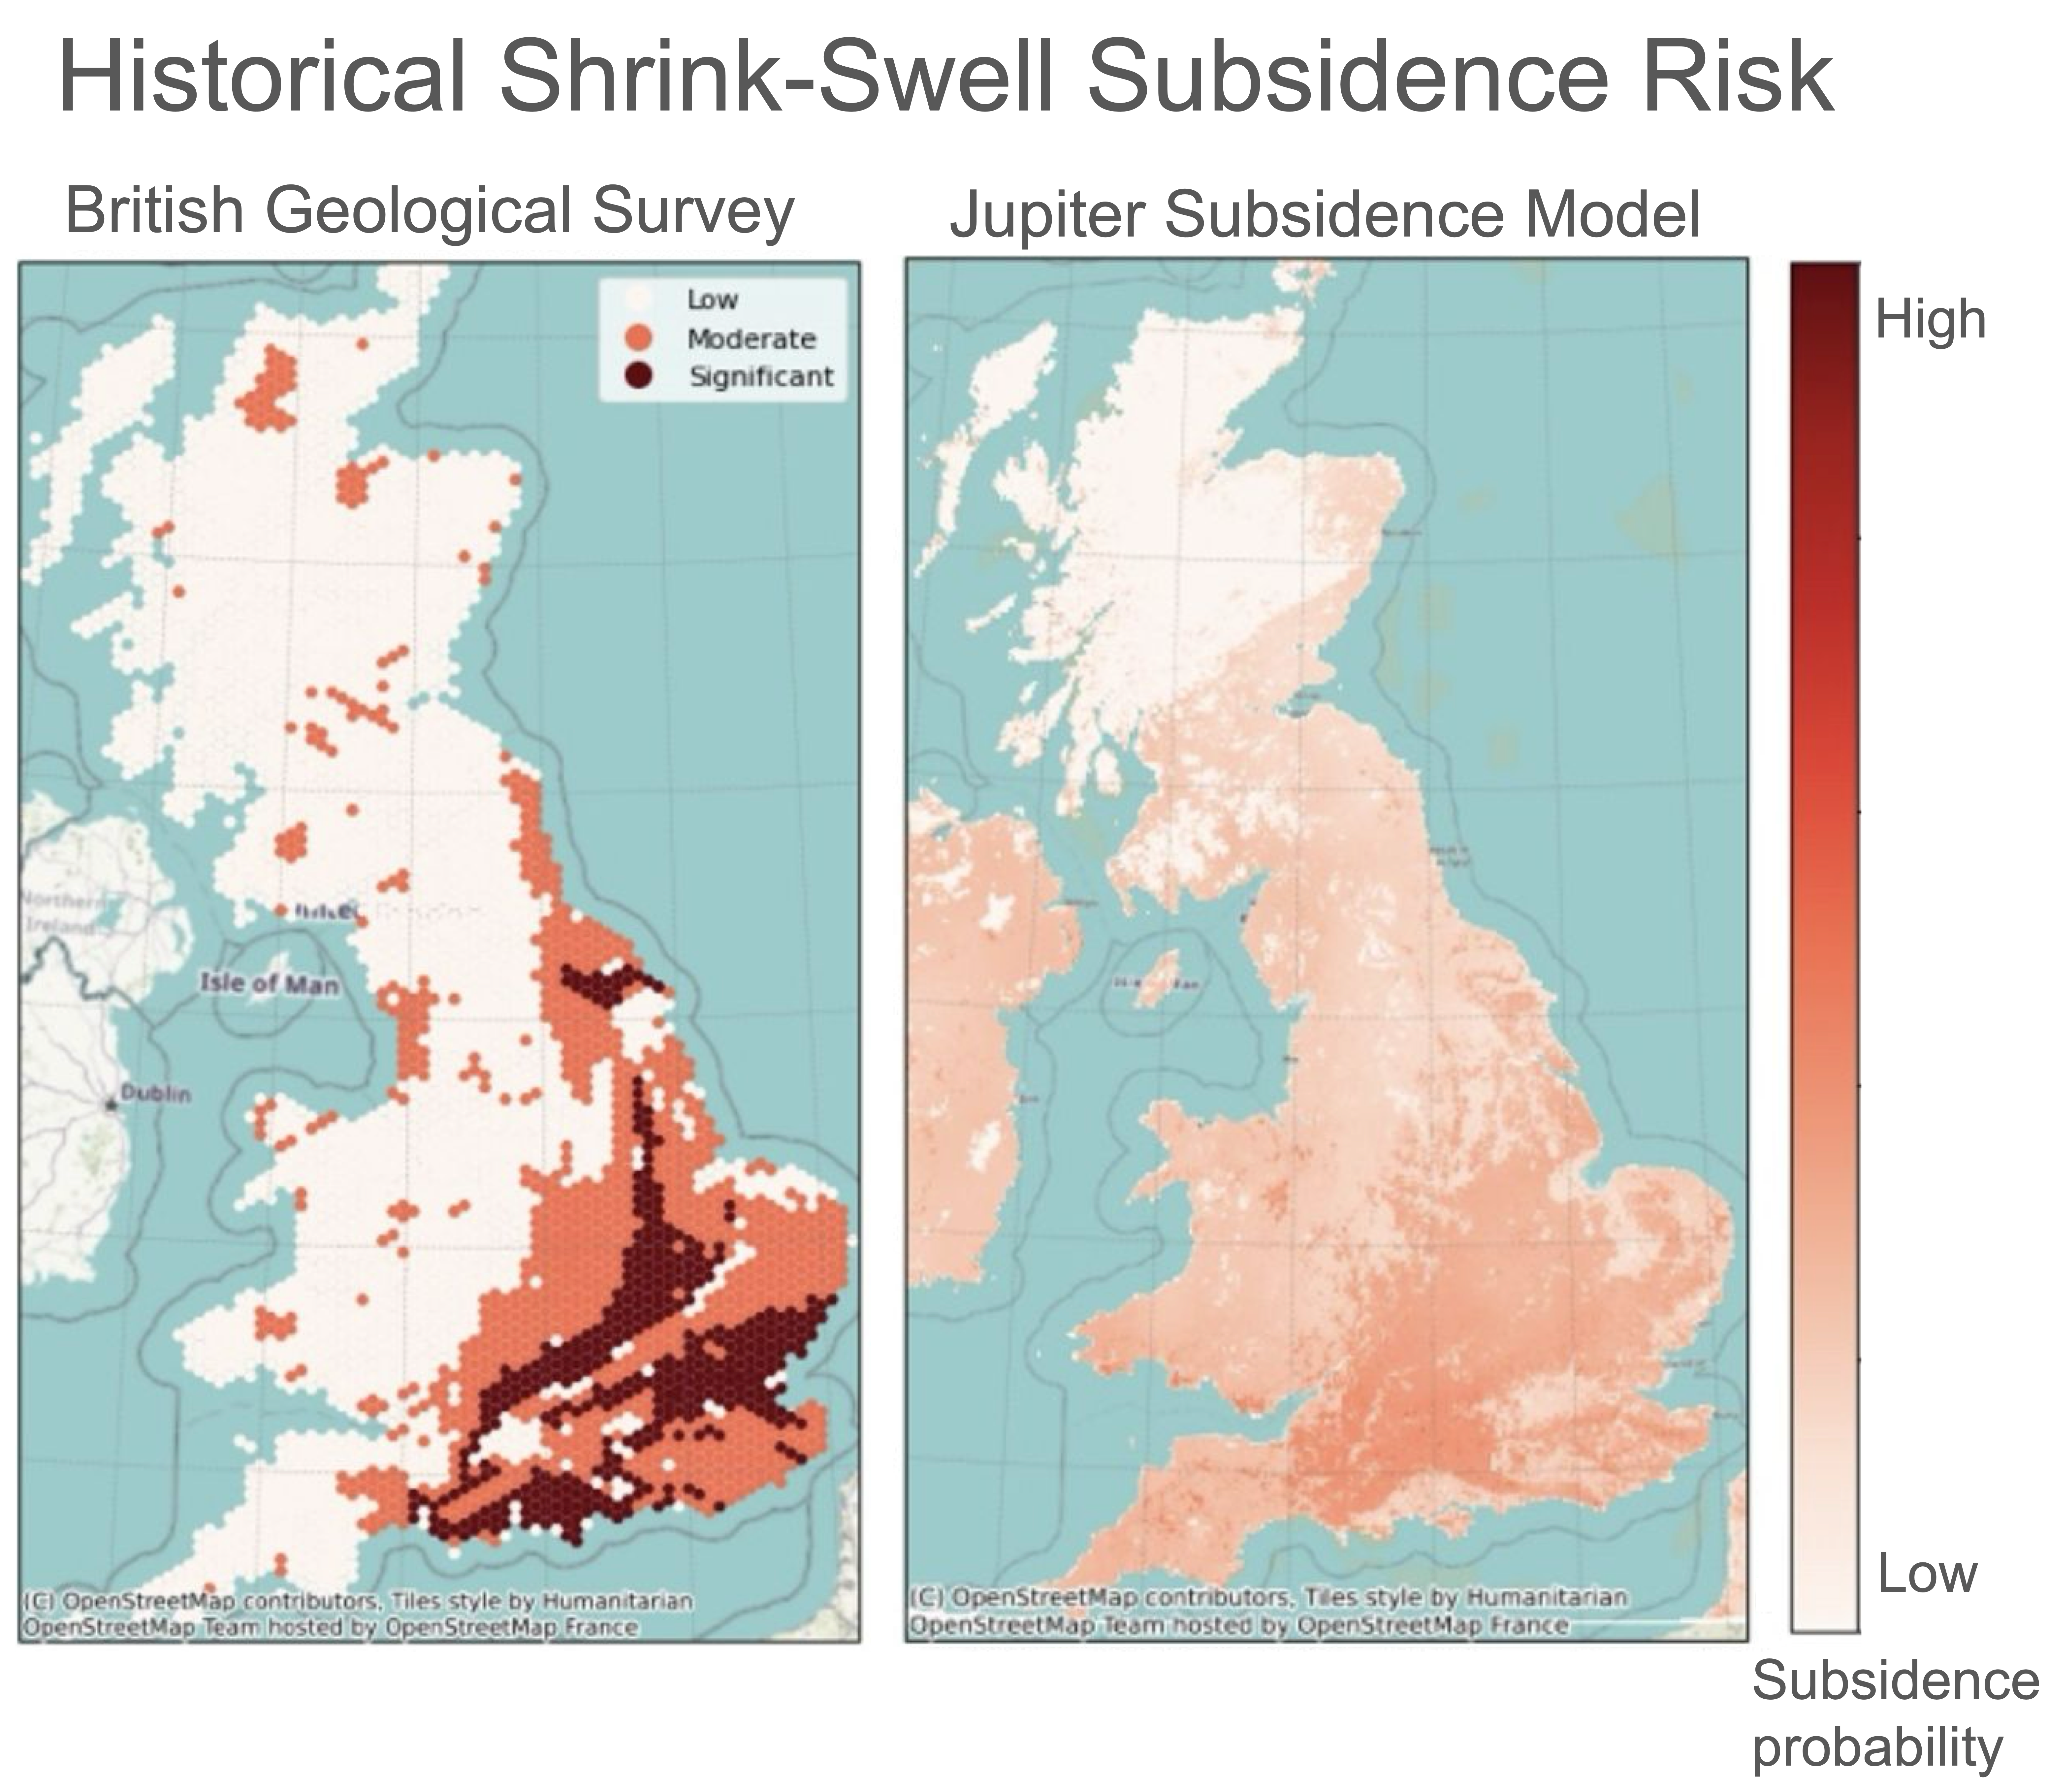
Extensive global datasets of shrink-swell subsidence risk have thus far been limited to select regions with key interests in subsidence, such as the United Kingdom. We can compare the Jupiter subsidence risk model to a subsidence potential dataset produced by the British Geological Survey (BGS). While Jupiter’s risk estimates are quantitative, continuous, and probabilistic, the BGS model is qualitative, classifying subsidence potential as “Low”, “Moderate”, and “Significant”. The Jupiter model correctly identifies the higher subsidence risk in southern and eastern England for the historical simulation.
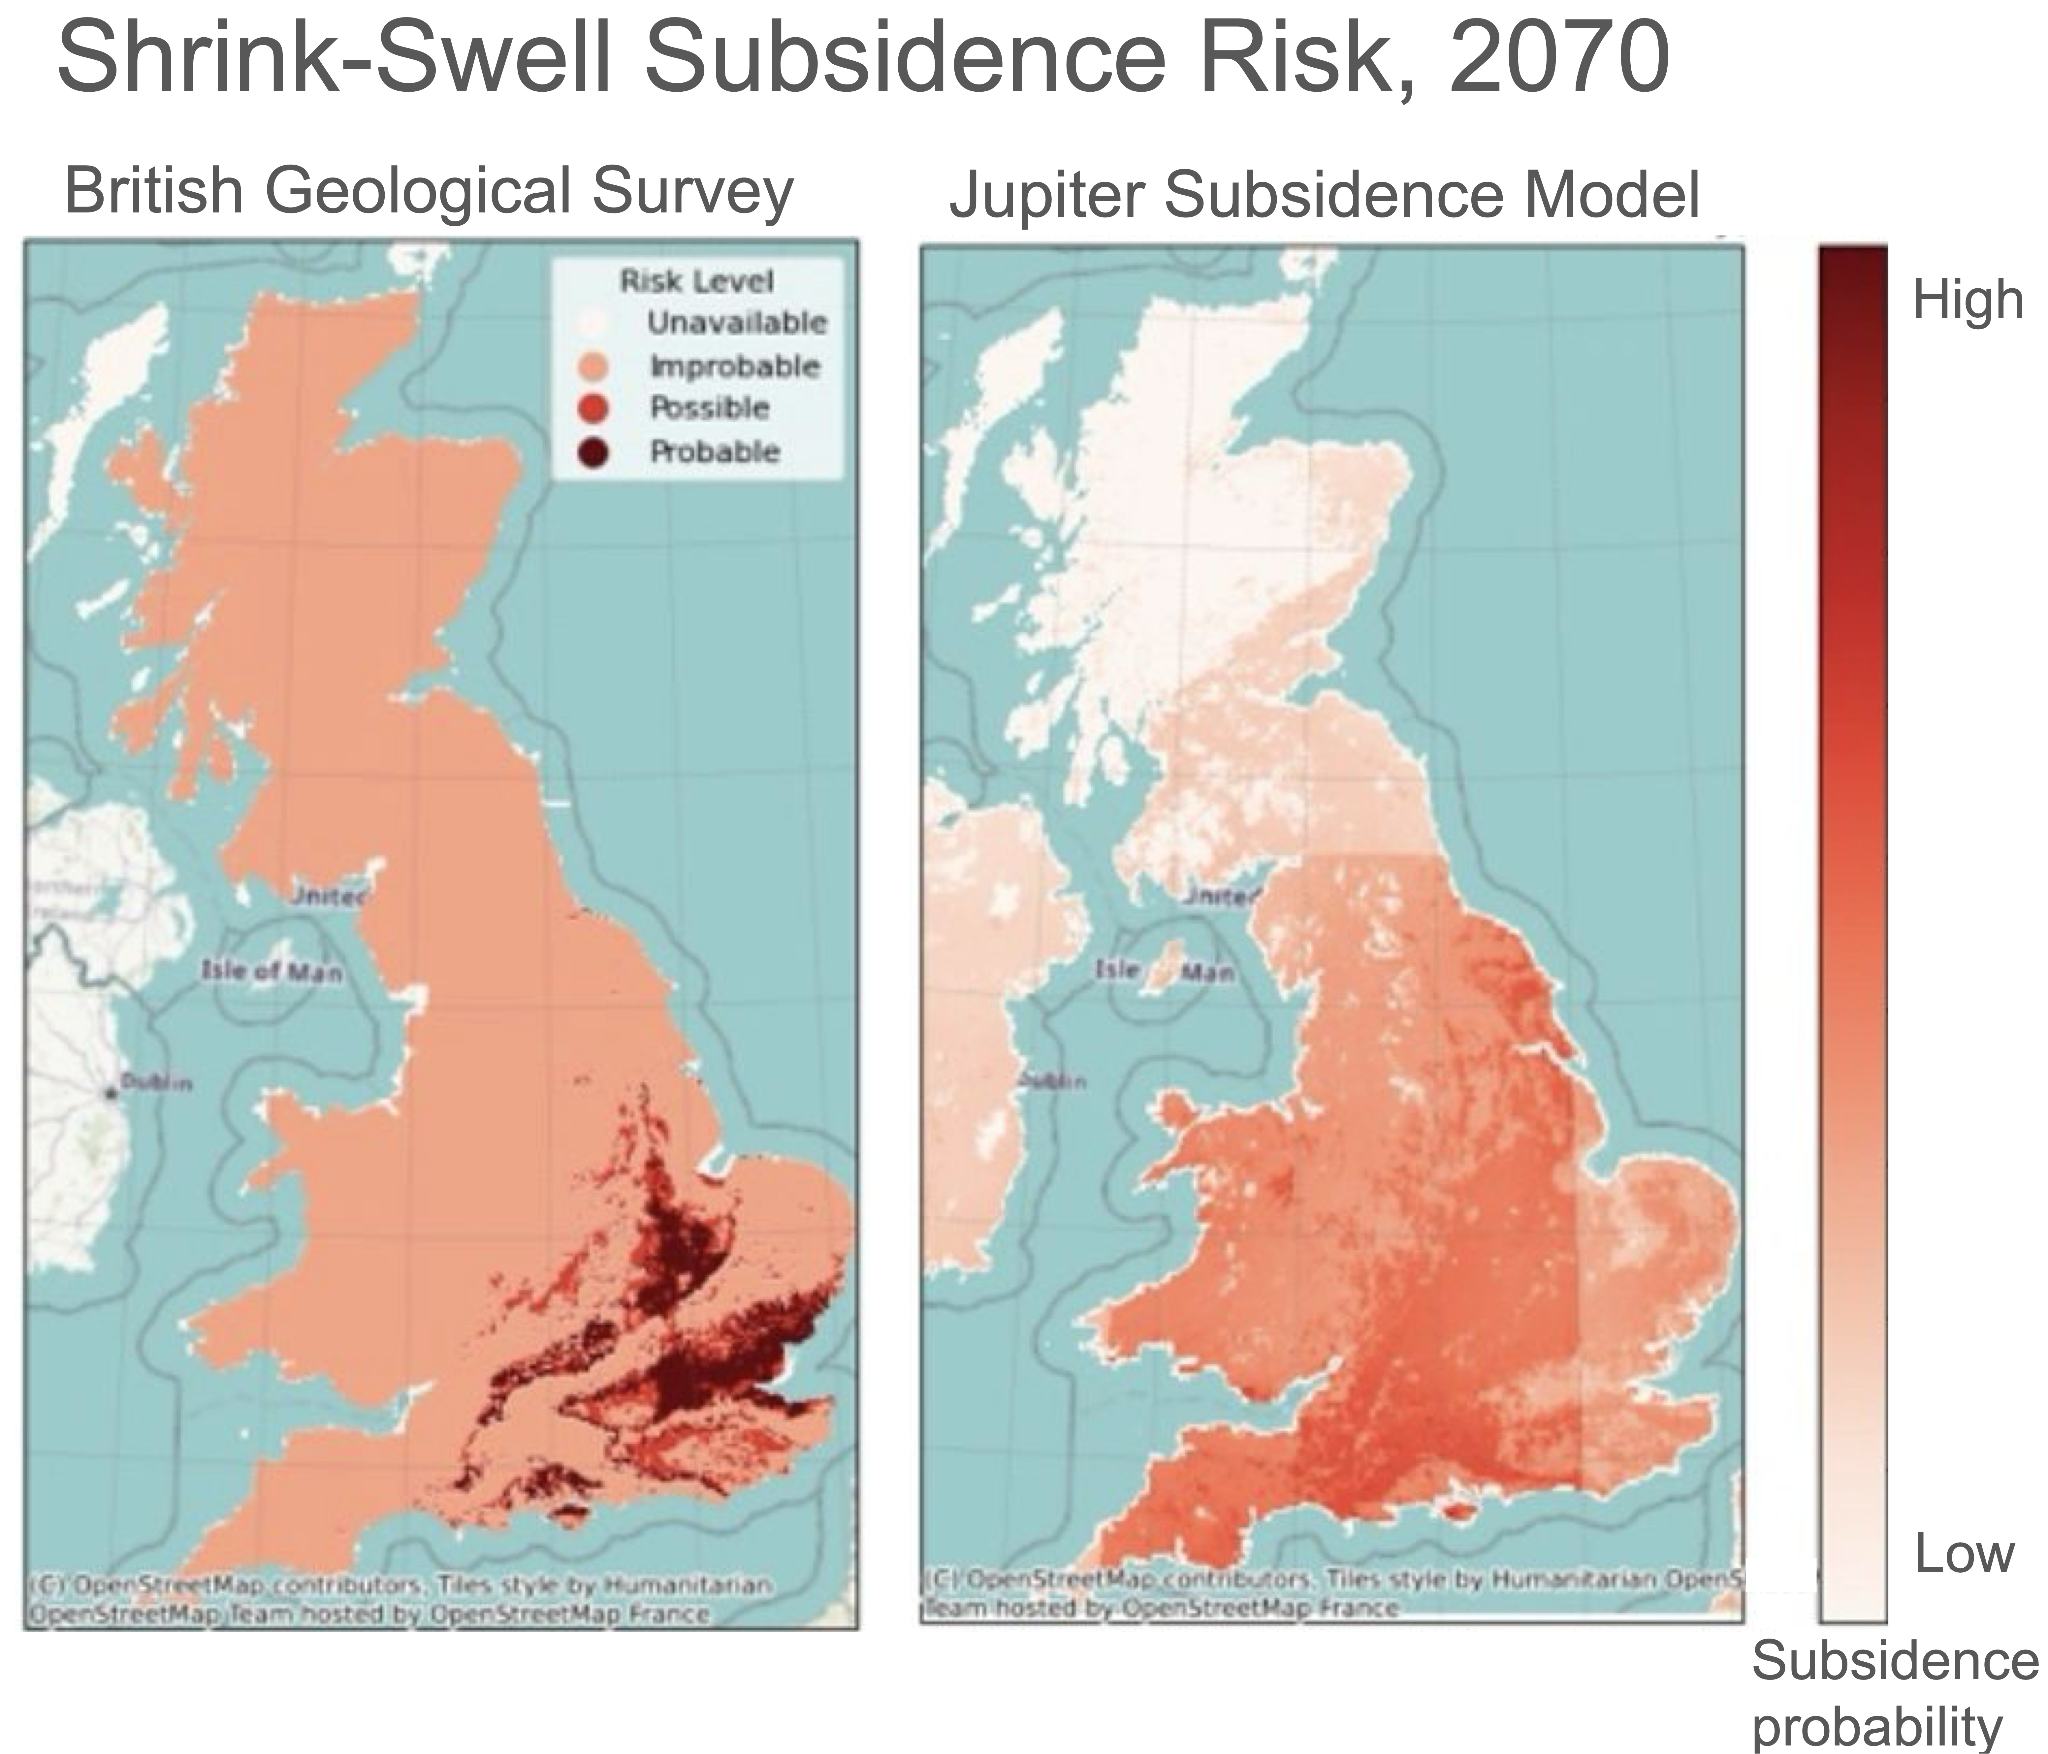
Estimates of future subsidence risk are even less common. The BGS has produced shrink-swell subsidence risk estimates for the U.K. in the 2030s (not shown) and 2070s. These risk estimates are once again qualitative, while Jupiter’s are quantitative and probabilistic. Both models agree on increasing subsidence risk in the future in southern and eastern England, with less risk in northern England and Scotland. The Jupiter model estimates that by 2070, subsidence risk could more than double in some locations in southern England. We note that the Jupiter model’s subsidence risk estimates for greater London are slightly lower than those produced by the BGS; this is likely due to more detailed clay mineralogy modeling in the BGS datasets.
Outside of the U.K., Subsidence Risk Increases in Tandem with Drought Risk–and Extreme Rainfall Risk
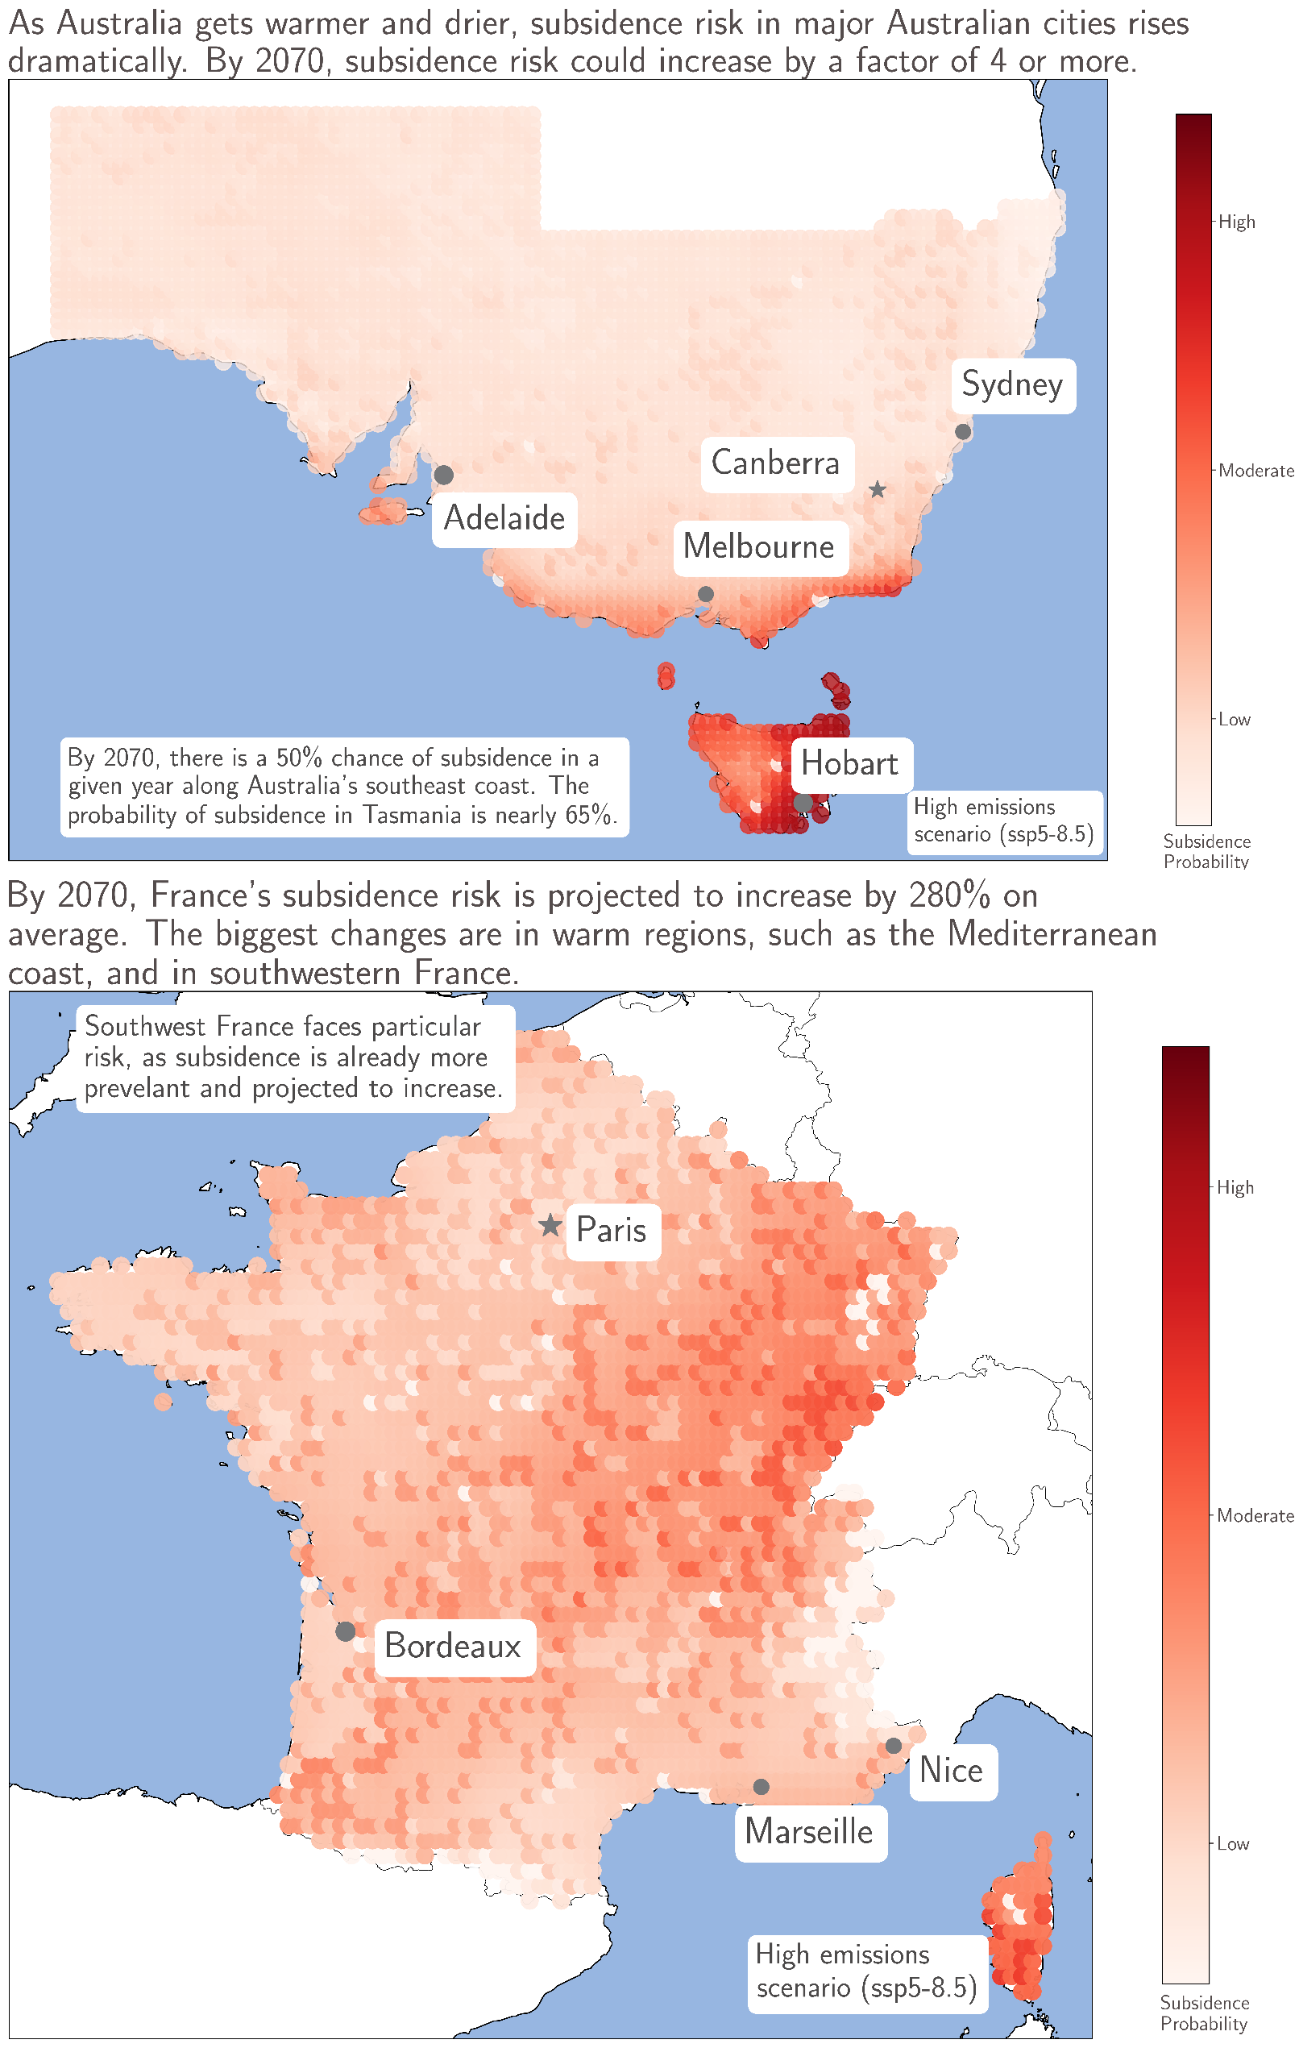
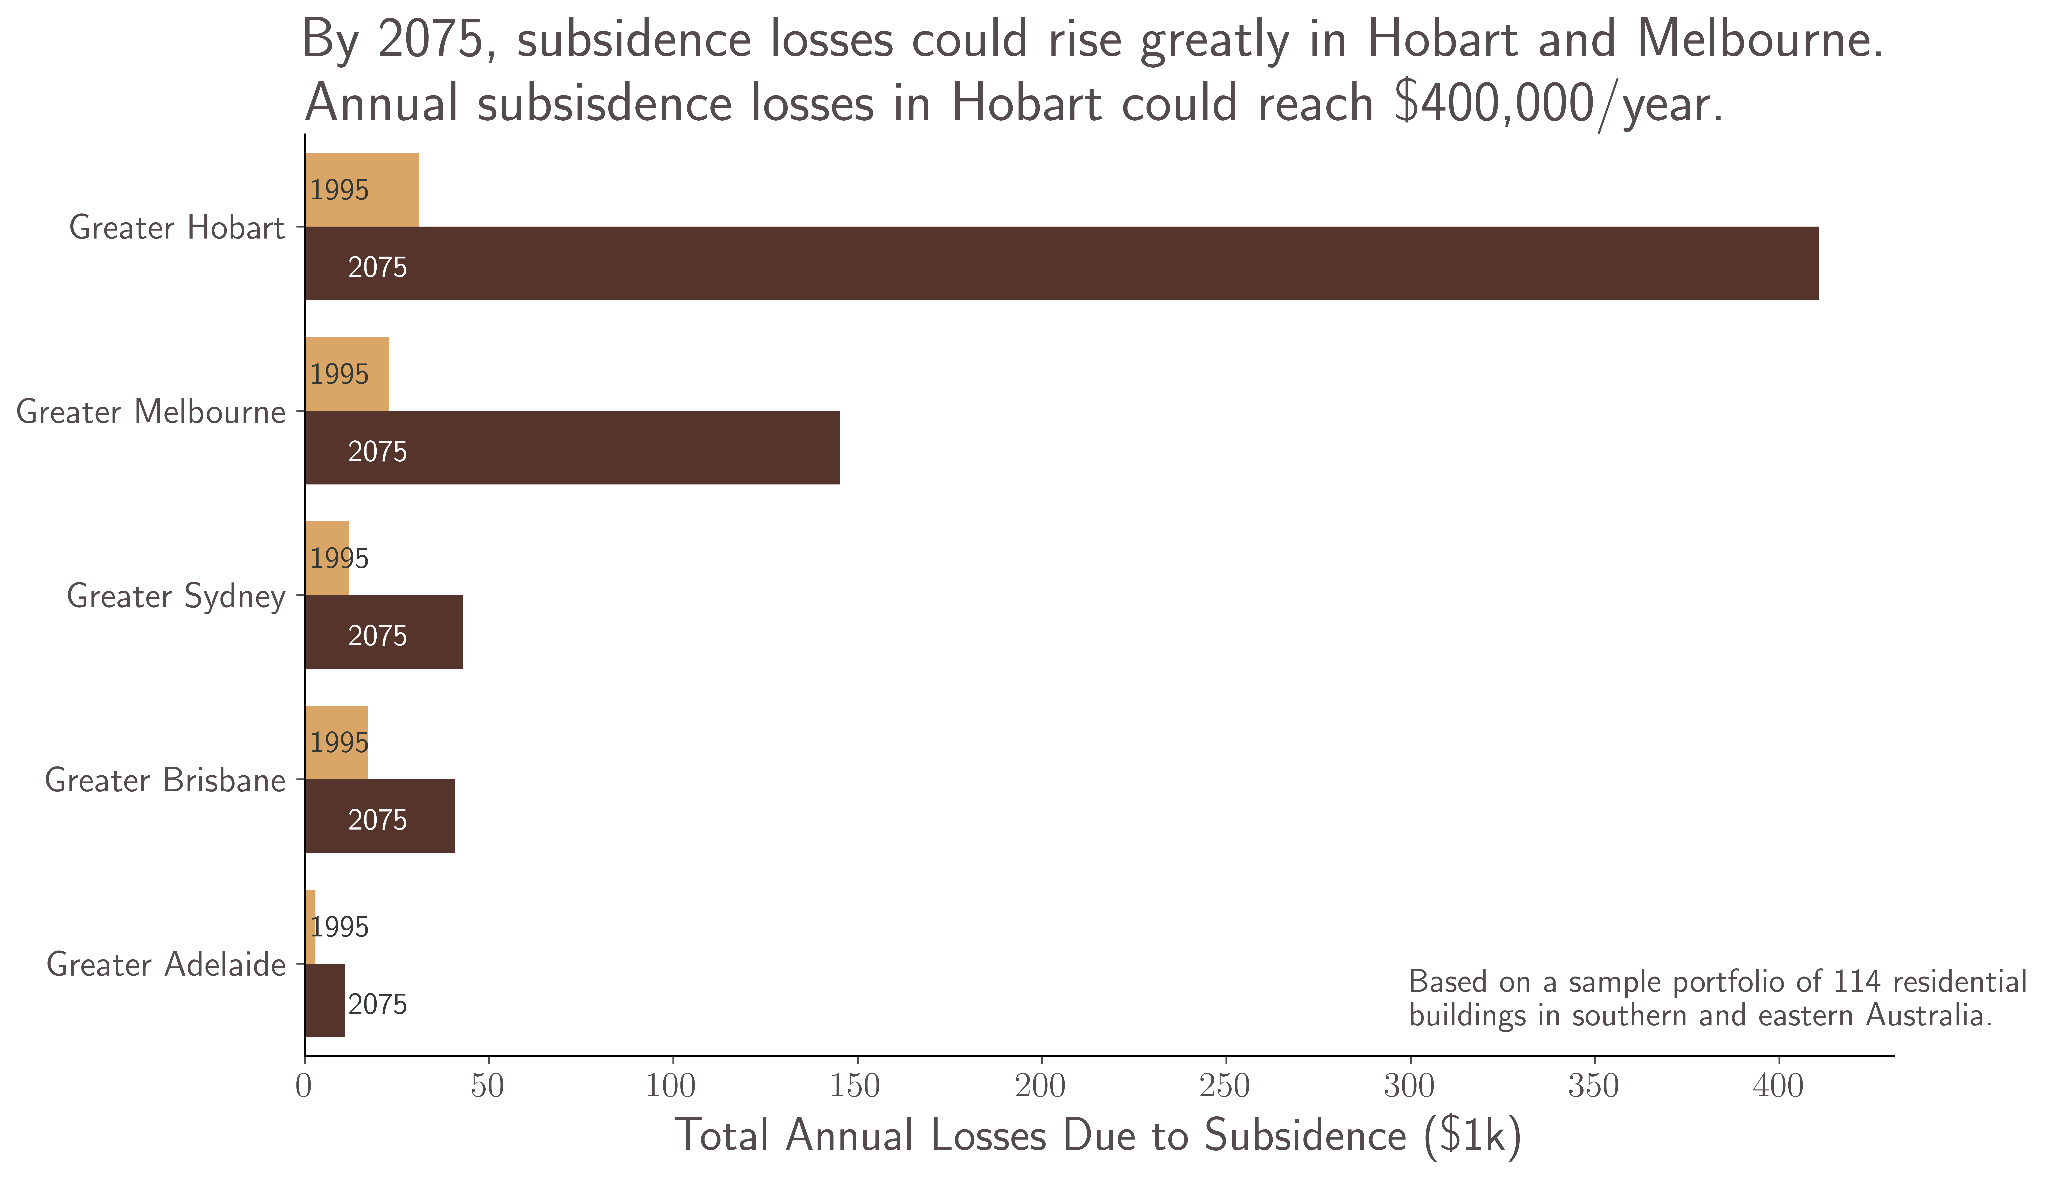
Beyond the United Kingdom, Jupiter models also predict large increases in subsidence risk in other locales, such as southeastern Australia and metropolitan France. In Australia, the largest increases in future subsidence risk are in the greater Melbourne area, much of which sits on reactive clay soils; and in Tasmania, where the annual probability of subsidence approaches 65% by 2070. Across southern Australia, Jupiter models predict that drought risk will increase by two or three times in New South Wales, the Australian Capital Territory, and South Australia. Victoria and Tasmania, which are typically wetter, see even bigger increases in drought risk in the future. The water-intensive eucalyptus, found across Australia, may further increase subsidence risk.
In France, the Jupiter subsidence model identifies historical exposure in regions that have been estimated to be high-risk by other studies, like the Loire Valley and Nouvelle Aquitaine (southwestern France). While these regions, along with eastern France, remain at an elevated risk in the future, exposure is rising the fastest on France’s Mediterranean coast and the island of Corsica. Jupiter models estimate that by 2070, subsidence risk will increase by over 250% on average across France, and drought risk will increase 150 - 350%. The increase in subsidence exposure in Mediterranean regions such as the Côte d’Azure and Occitanie, as well as Corsica, is likely driven by sharp increases in drought risk. Studies of French insurance claims have highlighted the large number of subsidence claims originating from central France and the Mediterranean--a number that will likely grow larger in the future.
Many of the regions with large increases in subsidence risk also see increases in the intensity of extreme rainfall events in the future. Heavy rainfall following drought can exacerbate the impacts of shrink-swell subsidence, and lead to further damage. In southeastern Australia, Jupiter models predict that a 100-year rain event will be 20 - 25% stronger by 2070 when compared to historical data. France follows a similar pattern, with increases in drought accompanied by increases in the intensity of extreme rainfall. Jupiter models estimate that extreme rainfall events in France will be 15 - 20% stronger by 2070.
Translating Physical Risk into Financial Impact: Modeling Subsidence Damage and Loss
The physical hazard model provides a standardized, quantifiable estimate of asset-level subsidence exposure, now and in the future. To understand the consequences and impacts of subsidence, we turn to the economic impact model. While the modeling physical risk requires only physical variables like soil, vegetation, and drought exposure, estimating damages and losses requires information about the asset as well as information about its hazard exposure.
Foundation Type: The Cornerstone of the Damage Model
The Jupiter damage and loss model considers a variety of asset attributes, such as the presence of a basement, the age of the building, and the type of construction. But the single most important predictor of subsidence damages is the foundation type. The foundation transfers the shrinking and swelling of the soil to a structure, with less resilient foundations allowing for more differential settling under buildings–and thus, higher damages. Thus, an asset’s foundation type provides the backbone of the Jupiter damage score for the subsidence model.
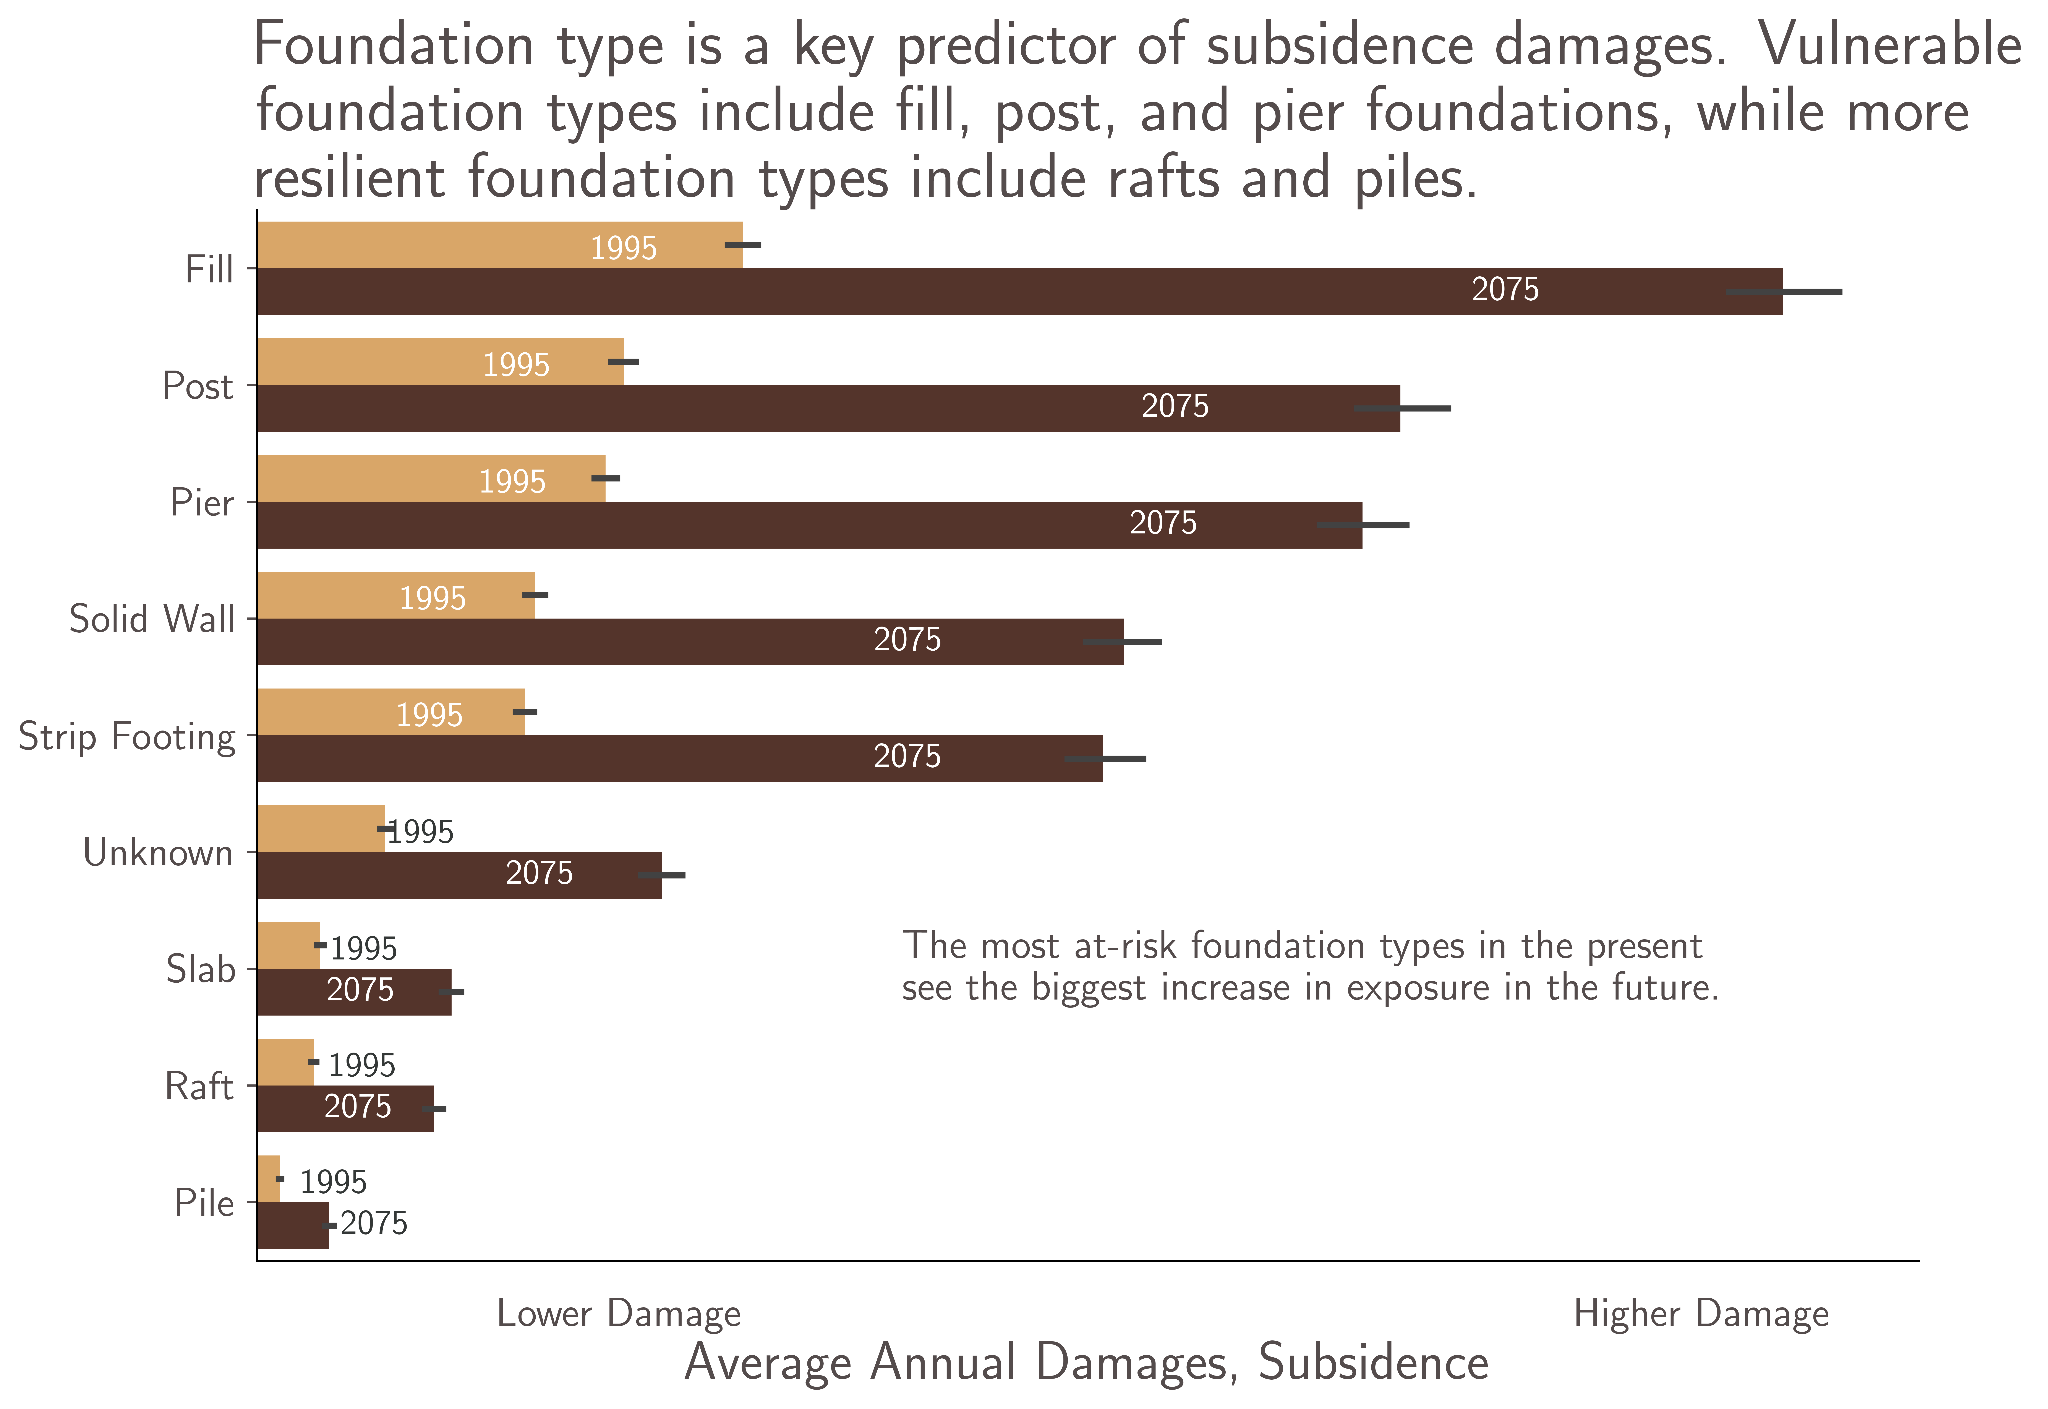
Superior foundations are resilient to differential movements in the soil. Deep foundations like pile foundations transfer building loads below the active subsidence, and are the best deterrent against subsidence damages. Certain shallower foundation types, like raft and slab foundations, can also be effective against subsidence–these constructions allow structures to move uniformly and flexibly, and provide some resilience against differential settling. Less resilient foundations include shallower foundations, and foundations that concentrate loads in specific places rather than spreading them out more evenly over the soil. Post, pier, and strip footing foundations concentrate loads over small areas, making them more vulnerable to differential soil movement. Fill foundations spread the loads over a wider area, but they are still highly prone to differential settlement.
The damage model also considers other building attributes, such as building age, the presence of a basement, construction type (e.g., brick versus timber versus stone), and property type (e.g., single-family residential, multi-family residential, commercial.).
Subsidence Damages Stack Up Against Other Hazards
Soil settling unevenly under a foundation paints a less dramatic picture than a home destroyed by floodwaters or ravaged by wildfire. Nevertheless, the damages wrought by subsidence can be substantial–especially for residential buildings. In a sample of over 4,700 residential buildings distributed across France, Jupiter’s economic impact models estimate that the average annual damages due to subsidence are comparable to those attributed to extreme winds and flooding, and greater than those attributed to wildfire.
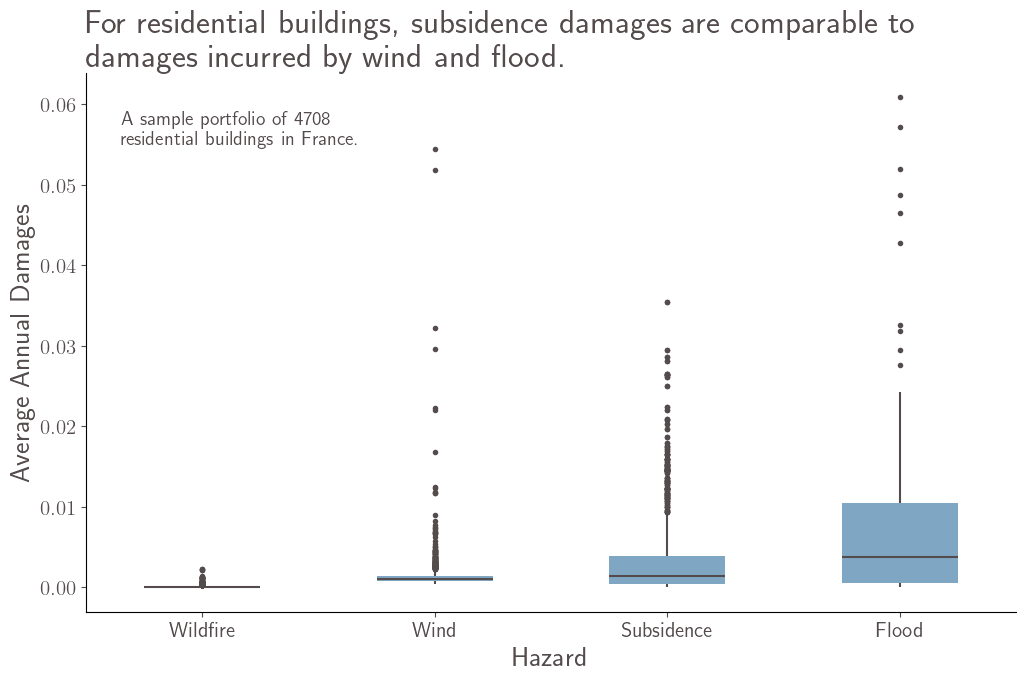
For hazards like extreme wind and wildfire, the probability of an individual asset incurring any damages at all in a given year is low–much lower than the probability of incurring any damages due to subsidence or flood, which are more widespread in France. For hazards like extreme wind and flood, the tail risk is higher than it is for subsidence. That is, the most damaging flood or wind event is more damaging than the most damaging subsidence event. But widespread exposure means that subsidence still presents a material threat to regions like France, even if the most extreme events are less catastrophic than an extreme wind, flood, or even wildfire event.
Pricing the Growing Risk of Subsidence
Insurance companies estimate that subsidence can cost millions in afflicted nations. In the United Kingdom, the Association of British Insurers estimates that subsidence payouts in the United Kingdom exceeded £300 million (over $405 million) in 2025. The Caisse Centrale de Réassurance, France’s public reinsurer, recently declared that, due to its influence on shrink-swell subsidence, drought is the costliest natural risk in France. Early estimates suggest that subsidence-related insured losses in France from 2025 could range from €770 million - €1 billion ($889 million - $1.15 billion). For a single home in the United Kingdom, the average repair cost for foundation subsidence in a home was £14,000 ($18,650) in 2023. In 2026, after two years of record hot and dry spring and summer temperatures for much of the U.K., the cost of the average subsidence claim has soared to £20,000 ($27,000). Based on this repair estimate, a subsidence repair is more than 5% of the value of a single family home, valued at the median home price. Jupiter’s subsidence damage model found that the mean damage ratio for an asset that represents a typical United Kingdom residential building was 6.25%. The historical annual subsidence probability across the U.K. ranges from 0 - 15%, meaning that the average annual damages across the country range from about 0 - 1%.
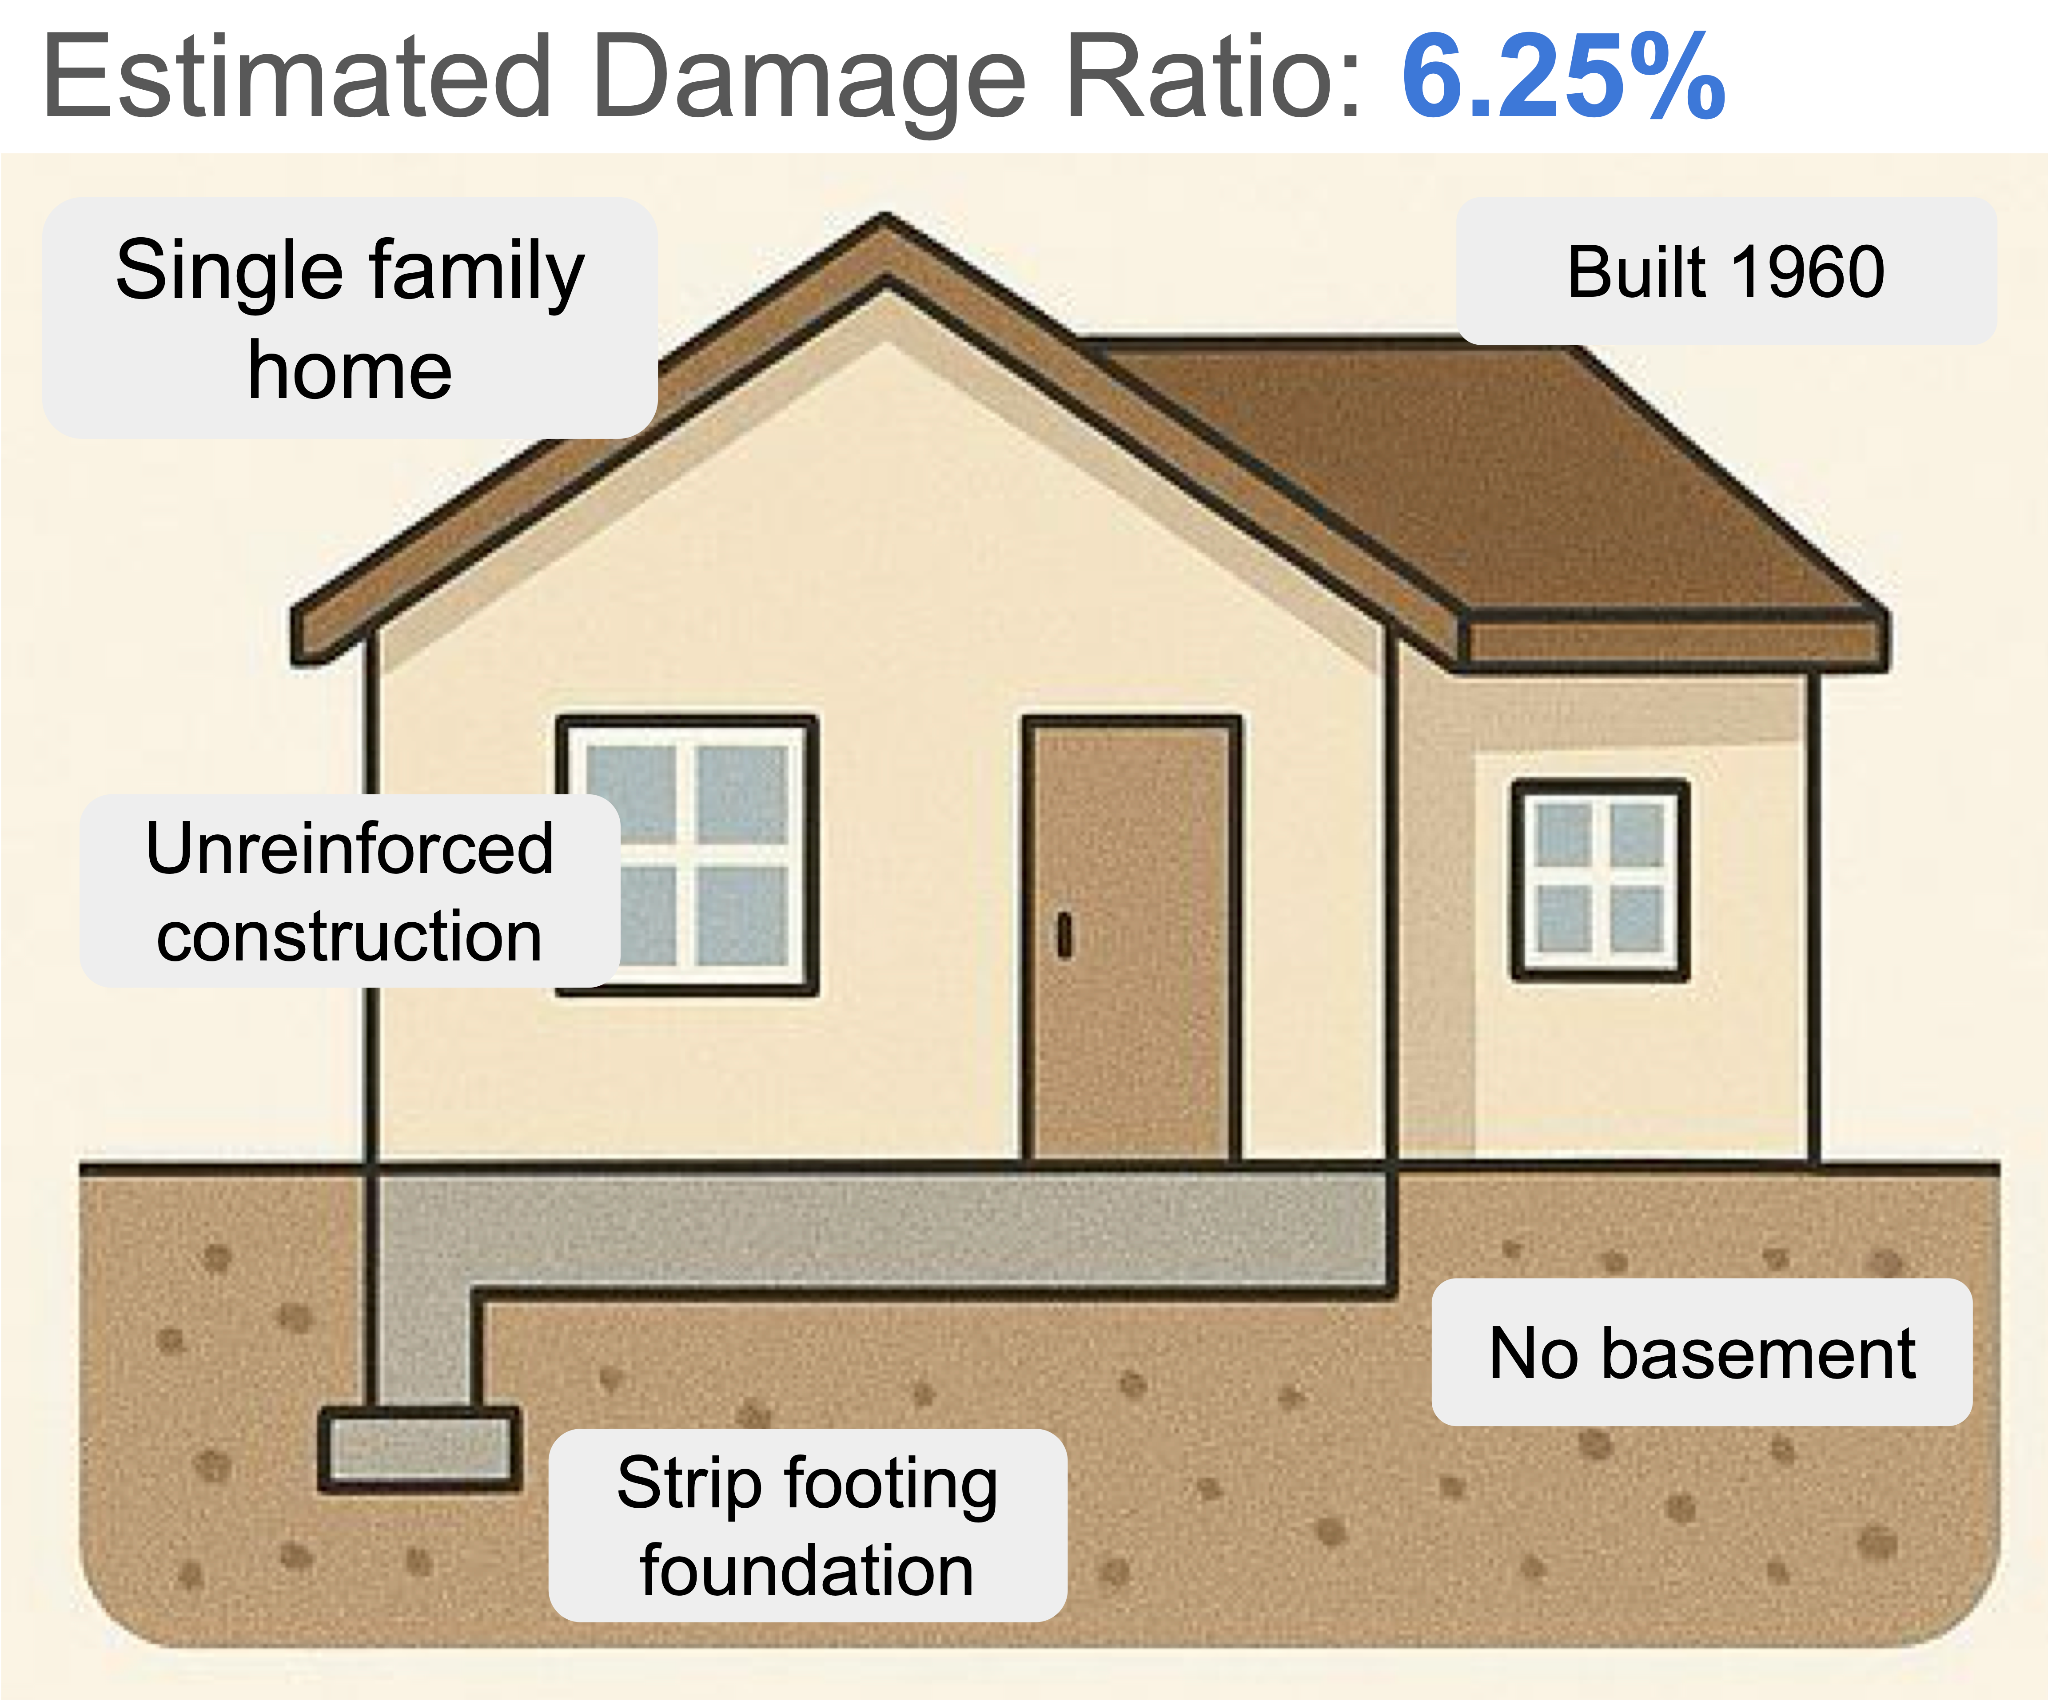
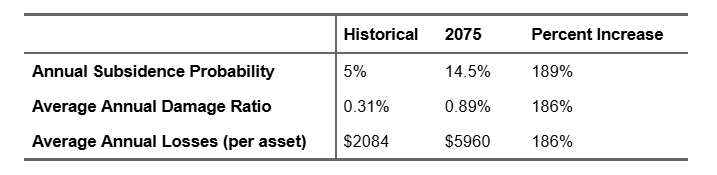
For single family homes like these, with vulnerable foundations, the financial impact of subsidence is poised to grow dramatically in the future as shrink-swell subsidence exposure increases. By 2075, under a high emissions scenario, Jupiter’s subsidence model estimates that subsidence damages and losses for single family homes with vulnerable foundation types could nearly triple compared to historical damage and loss estimates (Table 2). We note that the Jupiter damage model assumes that the subsidence hazard occurs and is fixed in the same year. But in reality, subsidence damages do not necessarily progress linearly–often, multi-year dry periods lead to increasingly large damages. And homeowners do not necessarily repair subsidence damage as soon as they notice it–rather, they often wait until damage reaches a certain level, and then fix many years worth of damage at once.
A recent study prepared by the British Geological Survey warns that by 2070, over 1.8 million properties in the United Kingdom, including over 25% of London, could be affected by subsidence under a moderate emissions scenario. Even a low emissions scenario could see over 500,000 impacted properties. Regardless of emissions, subsidence induced annual losses could easily reach US$1B per year in the United Kingdom over the next 50 years.
Subsidence risk is not distributed equally. While lower-risk areas may still see some increases in subsidence exposure due to increasing drought risk, higher-risk areas may see massively compounding risk. Take, for example, subsidence risk in several Australian cities. While drought risk increases in all of these metro areas, the increase in drought risk is much greater in wetter cities like Melbourne and Hobart than in drier cities like Sydney and Adelaide. The asymmetric increase in drought risk, coupled with significant clay content in the soil, means that subsidence damages and losses could increase substantially in cities like Hobart and Melbourne, and more modestly in less at-risk cities like Adelaide.
Preparing for the Future: Adapting to the Threat of Subsidence
Subsidence represents a substantial and growing physical and economic threat for much of the world. But unlike some other physical hazards, subsidence provides many opportunities for asset-level adaptation that can reduce vulnerability. Broadly speaking, these adaptation strategies use one of two approaches–limiting changes in soil moisture, and strengthening the structures directly.
Reducing soil moisture fluctuations. Reducing fluctuations in soil moisture, especially around a building’s foundation, can reduce the shrink-swell movement in the soil. Adaptations that address this concern include improving drainage under and around the foundation, installing a water-resistant or impermeable layer around the foundation, or installing a root barrier. Avoiding planting new trees, especially large or high-water trees, too close to the house is also beneficial, as these trees’ roots can remove moisture from the soil; though experts caution against removing mature trees, as that could destabilize the soil moisture profile.
Strengthening the structure. These adaptations focus on strengthening the structure itself, making it more resilient against shrink-swell movements. Foundation adaptation is generally the most effective strategy at combatting subsidence. Foundation adaptation can include making the foundation deeper, or using flexible foundation systems that can accommodate soil movement without damaging the structure above. Other adaptations that either increase the structure’s stiffness, or allow different parts of the structure to move independently without transmitting stress, can also improve an asset’s resilience to subsidence.
The Bottom Line: Shrink-Swell Subsidence Already Affects Millions of Properties Across the United Kingdom, France, and the U.S.--and that number is growing steadily.
Shrink-swell subsidence is already an expensive hazard for many at-risk countries. Each year, subsidence already costs the United Kingdom at least £400 million ($540 million); France over €600 million ($692 million), with some years’ claims exceeding €3 billion ($3.5 billion); and the U.S. nearly $15 billion. In Australia, an estimated 20% of the country, including major cities like Melbourne, sits on clay soils vulnerable to shrink-swell subsidence. Over 12 million French properties, including 54% of detached homes in France, face damage from subsidence; and over 20% of London already faces risks from subsidence. France’s Catastrophe Naturelle, the nation’s public-private insurer, estimates that subsidence-related damage could reach €43 billion ($50 billion) by 2050, while the United Kingdom could see between 1.8 and 4.2 million impacted properties. And subsidence risk can also be further compounded by heat waves–after the heat wave of 2022, U.K. insurers saw a marked increase in subsidence claims. In the U.K., where a very hot, dry spring and summer of 2026 followed a very hot, dry spring and summer of 2025, the impacts of subsidence have compounded. The average subsidence claim has increased by over £2,000 ($2700) compared to a year ago.
Millions of properties already face damage from clay shrink-swell subsidence. And as drought risk rises, the threat of damage from subsidence will also rise. But a plethora of asset-level adaptation strategies mean that subsidence risk can be reduced by controlling local soil moisture fluctuations, or by strengthening building structures to improve their resilience. Armed with present and future hazard estimates as well as a stocked adaptation toolbox, home and building owners, insurers, and governments of at-risk regions can be prepared to weather the threat of subsidence.
Contact Us
Jupiter’s first-of-its-kind globally applicable, climate-forward, asset-level subsidence peril and loss model can help institutions, insurers, and governments meet the threat of subsidence with resilience. This article is part of the Jupiter Research initiative, where our scientists and risk experts explore the climate forces shaping tomorrow's risks. Learn how Jupiter helps organizations quantify uncertainty, evaluate future scenarios, and make more resilient decisions in a changing climate. Contact us here.
References
- Holder, J. (15 August 2026). In One Week During Europe’s Record Heat Wave, Deaths Increased by 16,000. The New York Times.
- Association of British Insurers. (3 August 2026). Average claim for subsidence reaches record £20,000 amidst hot weather.
- British Geological Survey. (n.d.). Swelling and shrinking soils.
- Bateson, L. (25 January 2023). Property subsidence assessment: Helping to mitigate shrink–swell hazard risk. British Geological Survey.
- Swiss Re. (4 May 2021). A crack in the wall of your home: It could be subsidence, an almost invisible natural hazard.
- Clark, R., et. al., 2024: Soil moisture and water redistribution patterns in white oak (Quercus alba) saplings and trees in fragmented urban woodlands. J. Environ. Research, 263, 120106. https://doi.org/10.1016/j.envres.2024.120106.
- Corti, T., M. Wüest, D. Bresch, and S.I. Seneviratne, 2011: Drought-induced building damages from simulations at regional scale. Nat. Hazards Earth Syst. Sci., 11, 3335–3342, https://doi.org/10.5194/nhess-11-3335-2011.
- United Kingdom Met Office. (2 June 2025). Double record breaker: Spring 2025 is warmest and sunniest on UK record.
- United Kingdom Met Office. (1 September 2025). Summer 2025 is the warmest on record for the UK.
- Association of British Insurers. (17 February 2026). Adverse weather pushes property insurance payouts to £6.1 billion in 2025.
- British Geological Survey. (11 June 2026). Latest research emphasises climate-related subsidence risk to millions of British homes.
- Vicente-Serrano, S.M., S. Beguería, and J.I. López-Moreno, 2010: A Multiscalar Drought Index Sensitive to Global Warming: The Standardized Precipitation Evapotranspiration Index. J. Climate, 23, 1696-1718. https://doi.org/10.1175/2009JCLI2909.1.
- Poggio, L., et. al., 2021: SoilGrids 2.0: producing soil information for the globe with quantified spatial uncertainty. SOIL, 7, 217–240. https://doi.org/10.5194/soil-7-217-2021.
- Zhang, X., et. al., 2025: GLC_FCS10: a global 10 m land-cover dataset with a fine classification system from Sentinel-1 and Sentinel-2 time-series data in Google Earth Engine. Earth Syst. Sci. Data, 17, 4039–4062. https://doi.org/10.5194/essd-17-4039-2025.
- World Meteorological Organization. (2012). Standardized precipitation index user guide (WMO-No. 1090).
- Jones, L. D., & Jefferson, I. F. (2012). Expansive soils. In J. Burland (Ed.), ICE manual of geotechnical engineering: Volume 1: Geotechnical engineering principles, problematic soils and site investigation (pp. 413–441). ICE Publishing.
- Mzungu, N.P., et. al., 2025: A novel clay shrink-swell buildings damage model: From unstructured insurance data to the creation of buildings database, and the proposition of damage severity scale. Int. J. Disaster Risk Reduction, 127, 105636. https://doi.org/10.1016/j.ijdrr.2025.105636.
- Crilly, M., 2001: Analysis of a database of subsidence damage. Structural Survey, 19, 7-15. https://doi.org/10.1108/02630800110384185.
- Page, R.C.J., 1998: Reducing the cost of subsidence damage despite global warming. Int. J. Building Pathology Adaptation, 16, 67 - 75. https://doi.org/10.1108/02630809810219641.
- British Geological Survey (2018): BGS GeoSure version 8. British Geological Survey. (Dataset). https://doi.org/10.5285/4325c0ac-21bf-4703-971a-2cc0e9fdad8e.
- British Geological Survey. 2018. BGS GeoClimate UKCP09 Open. British Geological Survey (Dataset). http://data.bgs.ac.uk/id/dataHolding/13608476.
- Li, J., et. al., 2016: Shrink-swell index database for Melbourne. Australian Geomechanics Journal, 51, 61-76.
- Australian Bureau of Agricultural and Resource Economics and Sciences. (2019). Eucalypt forest. Department of Agriculture, Fisheries and Forestry.
- Sun, X., and J. Li, 2023: Case Study of Ground Subsidence Caused by the Drying Effect of a Group of Australian Native Eucalypts. J. Performance Constructed Facilities, 37. https://doi.org/10.1061/JPCFEV.CFENG-4254.
- Charpentier, A., James, M., and Ali, H., 2022: Predicting drought and subsidence risks in France. Nat. Hazards Earth Syst. Sci., 22, 2401–2418. https://doi.org/10.5194/nhess-22-2401-2022.
- Bureau de Recherches Géologiques et Minières. (15 September 2020). Clay shrinkage and swelling: Supporting the General Directorate for Risk Prevention in implementing the ELAN Act.
- Yahoo Finance. (17 February 2026). Record £6.1bn paid on property insurance claims in 2025.
- TerraStab. (6 July 2026). RGA sécheresse: Risque CatNat numéro un.
- Mainmark. (December 2025). How much did it cost to fix foundation subsidence in 2025.
- British Geological Survey. (19 May 2021). Six ways to prepare your home for climate change related subsidence.
- United Nations Office for Disaster Risk Reduction. (27 September 2024). Shrink-swell subsidence (GH0310).
- Mintek Resources. (8 September 2023). Dealing with expansive soils in construction.
- Bateson, L. (25 January 2023). Property subsidence assessment: Helping to mitigate shrink–swell hazard risk. British Geological Survey.
- Karunarathne, A. N. (2016). Investigation of expansive soil for design of light residential footings in Melbourne [Doctoral dissertation, Swinburne University of Technology].
- Gilliver, L. (2 April 2026). ‘Shrinking-swelling’ phenomenon is putting 12m French homes at risk. Is climate change to blame? Euronews.
- British Geological Survey. (19 May 2021). Maps show the real threat of climate-related subsidence to British homes and properties.
- France Assureurs. (20 October 2023). La sécheresse et son impact sur les habitations : quelles solutions de prévention et de protection?
- Mills, E., et. al., 2026: Assessing sustained high-heat multi-hazard events through earth observation and impact chain analysis in southeast UK. iScience, 29, 115423. https://doi.org/10.1016/j.isci.2026.115423.
