.webp)
Climate risk is redefining what it means to stress test economic resilience. As physical climate hazards grow more frequent, more severe, and more correlated, financial institutions face a stress-testing challenge that today's regulatory frameworks were not designed to solve. What is needed is a practical, extensible approach to climate stress testing — one grounded in multi-hazard, multi-event analysis and calibrated to a climate that has already changed.
Banking and lending institutions conduct stress tests to ensure financial resilience under potential risks. They test resilience following hypothetical financial shocks and systemic risks, addressing regulatory compliance, risk management, and capital planning. While stress testing regulations in some regions or countries are more standardized than others (e.g. in the EU more standardization is applied than in the US), wide variability exists across regions, countries, and banks in stress testing methodologies and expected outcomes. This white paper illustrates an approach to constructing a plausible and useful stress test. It is based on simple concepts that are easily extensible to the real stress testing applications commonly used by regulators worldwide.
One commonality is that climate stress testing is usually completed by evaluating the impacts of plausible, yet potentially hypothetical, climate and weather scenarios on a portfolio. Depending on the jurisdiction and realistic threats, scenarios may be constructed based on individual events or a broader view of multiple climate-related hazards. The purpose and structure of these take different forms, reflecting national economic drivers, geographic regions of coverage, and primary climate hazards affecting those regions. The variation can be illustrated by comparing the stress tests regulated by the Prudential Regulatory Authority (PRA) that informs the Bank of England tests spanning material risks across multiple hazards and a global view, with the Monetary Authority of Singapore (MAS) that focuses on a small number of severe tropical rainfall events local to Singapore. Both converge on asset-level analysis based on granular underlying data. In many cases the same bank will be subject to both test requirements, and thus both event-driven tests and tests constructed in a probabilistic framework. The broader view is the newcomer here, and offers one step away from stress tests based on a small number of event scenarios - that is, a step in the right direction for regions or portfolios that can be exposed to multiple climate stressors.
Why Many Stress Tests Fall Short
Climate change introduces new classes of stressors, and climate risk requires new thinking to develop stress tests that have not been historically applied as a matter of practice. The stress testing allowed by regulators has not yet reached a state that leads to transparent material stress indicators. In short, they do not include multiple hazards, multiple events, and changing climate baselines impacting both direct and indirect losses to portfolios. As an aside, they also do not yet reflect what is possible given the state of climate science.
For example, stronger storms and more severe heat waves than have been observed are already possible in the current climate, and they can both stress portfolios during the same year or at the same time in different regions. That fact is not accounted for in scenarios that form stress tests today. More critically in a climate-change context, the impact on a financial portfolio from one strong storm cannot be the basis for a stress test meant to represent climate impacts that are plausible today and in the next 20 years, except under narrow circumstances. In reality and in most cases, a portfolio can assume risk from multiple climate-related events over a short period of time that can drive direct, indirect, and systemic risk impacts. Those events need not even be the most extreme.
Effective stress tests are closely linked with risk management, which requires a broad look to assess material risks; the PRA clearly recognizes this and is using climate stress tests to promote best practices in physical risk management, though the proposed forthcoming tests still fall short of material stress to large banks. A response aligning with best risk management practices would favor a bottom-up approach, beginning with assessing material risks to assets in which a bank has interests.
Stress tests based on a small number of event scenarios cannot, by definition, identify material risks from broad stressors, precisely because the limited event scenarios cannot span the exposure material risks.
An easy example is the U.S. Federal Reserve Bank’s exercise with the six largest banks in the U.S., based on five hypothetical tropical storms that could hit the mid-Atlantic states. No single storm, even much worse than imposed in those tests, would be material for these huge banks, which will only be stressed by a range of events spanning multiple hazards and occurring across their portfolios within a reasonably short time frame.
A more nuanced example is the MAS test, based on extreme tropical rainfall, with associated flooding that dominates extreme events in Singapore. While this approach stresses local infrastructure, it cannot address stressors that arise from business interruptions from other sources and which can add additional material stress. Examples include intermittent power outages and supply chain disruptions, which can accumulate to devalue assets and apply friction to business operations.

Finally, the climate has already changed and will continue to change. The effects so far are felt more on tail events. Still, one event is insufficient to assess material stress. Instead, the changes mean that combinations of events, spanning hazards and time windows, and which may combine “garden variety” high-impact events with extreme events, look different than they did 20 years ago. Factoring this reality into stress tests is imperative.
The banking industry can move toward useful resilience assessments by moving from a small number of single-event scenarios toward tests that factor in multiple hazards and events, across regions that affect portfolios through indirect impacts, and accounting for the reality that the climate has substantially changed, and will continue to do so for the foreseeable future.
The following should inform any reasonable physical climate risk stress test for large financial institutions:
- Catastrophic events are possible now, and were possible 30 years ago, that we have not yet observed.
- A sufficient number of stressors need to be applied - the conditions for single-event stresses that would be catastrophic to financial institutions are not generally satisfied.
- Individual catastrophic events are not needed for climate stressors to amount to a material risk; concurrent or a series of moderate stressors can be sufficient.
- Both insurable and uninsurable losses can stress portfolios.
A Framework for Better Stress Testing
The recommendation in the above bullets is supported, and potentially superseded, by research that suggests climate stress should be addressed within the macroprudential context of greater compound risks (e.g. Hiebert and Monnin). That is, climate shocks can nonlinearly interact with other economic shocks. The U.S. Federal Reserve Bank Pilot Climate Scenario Analysis Exercise Insights, from 2024, note that “the cumulative effects of multiple hazards over time, or a more comprehensive incorporation of indirect impacts and chronic effects, could meaningfully affect the nature of the exercise and the channels through which physical risks could impact their portfolios,” but were non-specific about how to evaluate cumulative effects.
Below we construct a simple example of how to construct a stress test that satisfies the framing above, based on open data, to demonstrate how generic stress tests that span regions and hazards can be constructed. Stress tests can be constructed in a similar manner with Jupiter data, which would ensure accounting for current and future climates. Importantly, any number of scenarios can be constructed with this approach, leading to probabilistic assessments that would be consistent with risk analysis practices. To keep it simple, we demonstrate a sampling method that is straightforward to apply. The example here is based on open data and does not rely on exposure knowledge; the approach can be applied to portfolio exposure, which is a more realistic application. The following sections explain how this example easily extends to bottom-up assessment of material risks starting from bank portfolio exposure.
Structuring a Useful Stress Test
A bad year, or a bad period of a few years, is more likely to be economically stressful to a large bank than a single catastrophic event.
For illustration, consider only a single bad year, and recognize the concept is easily applicable to multiple sequential years. We can focus this illustrative discussion on the hazards and how to use them to construct a stress test, and accept that the tests apply to various risks that impact financial performance and resilience.
A stress test is possible to construct by statistically sampling from event distributions, finding the costliest year, constructing a storyline to assess plausibility, and evaluating the impact of the events on a portfolio. Huge event catalogs are not required. We demonstrate an approach based on documented billion-dollar events, though other sources of information to provide samples are available.
Sampling from an observed distribution enables accounting for events that have not been observed, but are possible, plausible, and have some likelihood of occurring today. An example is given by Emanuel, who showed we can today have a year with much greater impacts from tropical cyclones than we have yet seen – it is just good luck that we have not yet seen those years. Those arguments are directly extensible to multi-hazard stresses, and to future climate changes, as described below. Multiple samples can be drawn to fully assess risk distributions, though for demonstration we include a single sample.
A source of historical event information is a starting point. This should be replaced by data more certain to be representative of today’s climate, but that is not needed for illustration. The U.S. National Centers for Environmental Information (NCEI) has recorded inflation-adjusted billion-dollar weather and climate disasters from 1980 to the current year. Both the total number of, and total cost of, billion dollar events can be derived from these data. The approach here uses only the total annual cost, recognizing that basing an approach on the total number of events will yield a test with some different characteristics. Though the data itself may have flaws, those are not relevant here. A strength of these databases is that they can include both insurable and uninsurable losses; financial stress goes well beyond insurable losses.
The database classifies billion-dollar events into seven categories: drought, flooding, freeze, severe storm, tropical cyclone, wildfire, and winter storm. Three of these (drought, freeze, and wildfire) can be characterized as regional and annual extreme events and represented as binary in the database (e.g., a particular year and region either had a costly drought, regional freeze, or multiple costly wildfires, or it did not). The probability of such an event occurring was statistically modeled as a function of the Global-mean Surface Air Temperature (GSAT) anomaly, which is the difference from the time-mean GSAT, using logistic regression. The other categories (flooding, severe storm, tropical cyclone, and winter storm) are characterized by numbers of events in the year, and the rate of each type of event in a given year modeled as a function of the GSAT anomaly using Poisson regression. For a year with a given GSAT anomaly, the occurrence and number of each type of event was simulated from the associated regression model. Costs for each event were then simulated via Monte Carlo sampling from the distribution of costs for each event type. Total cost was obtained by summing across the event types, and the simulation was repeated many times for a target number of years.
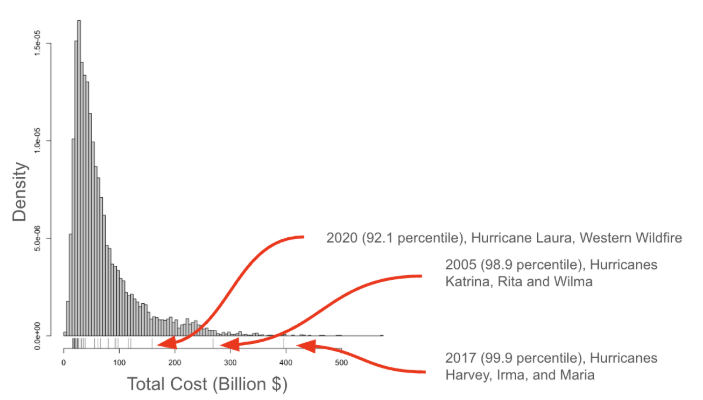
Sampling based on the historical period alone helps to put some of the worst observed historical years into context of what’s possible. Figure 1 shows a histogram of annual costs from 10,000 years of sampling the distribution defined by the losses as reported by NOAA, and assigning a GSAT anomaly of zero (the GSAT a constant defined as the temporal mean). In the database, 2017 was the costliest year, dominated by Hurricanes Harvey, Irma, and Maria. Hurricanes Katrina, Rita, and Wilma resulted in second-place 2005. Sampling suggests that among 10,000 years consistent with the reference period 1991-2020, we could have expected to see 10 years that exceeded 2017 costs – it could have happened any time even if we have not yet experienced it.
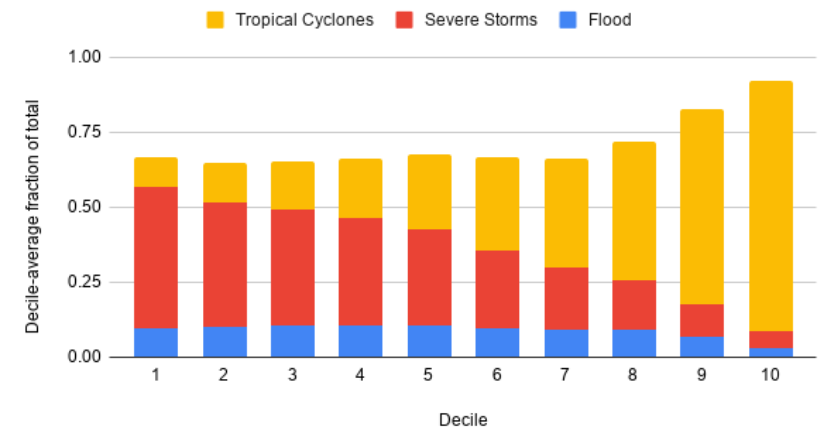
The contribution of individual perils changes from the lower loss years to the highest. Figure 2 summarizes the distribution. Flooding from non-TC sources, severe storms including hail, and TC losses from wind and TC-driven flood contribute the most to losses across the deciles. The most notable behavior is that TCs contribute disproportionately more to the total loss in the costliest years. While that may not be a surprise, the total loss value for severe storms and other flooding also increases toward higher deciles, albeit not as dramatically as TC-driven losses. In some years wildfire, heat, drought, winter storms and freezes can be significant contributors, demonstrating the importance of drawing from broad stressors.
The worst possible years resulting from this sampling amount to approximately 1.5% of U.S. GDP. By themselves then, these numbers could be used to construct a stress test that would apply at the level of the US GDP without identifying individual events of any kind, but they do not reflect stress on an individual institution. Institutional exposure is required for that, and the simple approach described here directly applies to portfolio exposure as described later.
Accounting for Climate Change
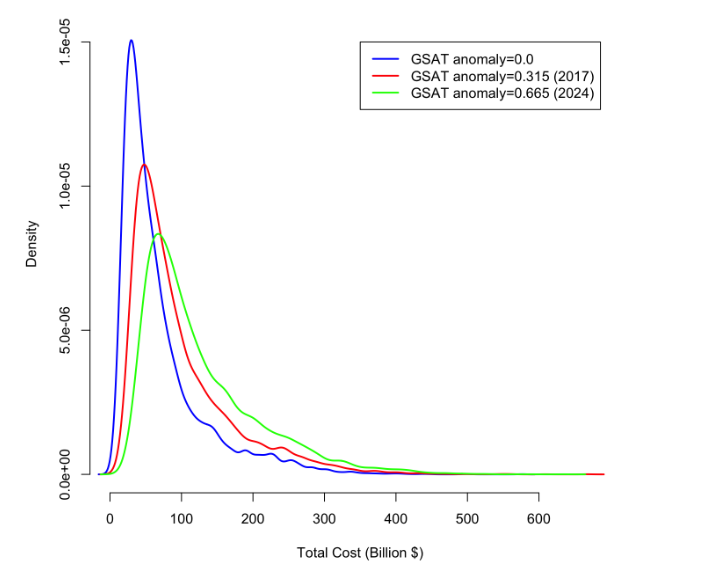
The illustration above is based on the reference period of 1991-2020, drawing years while using a GSAT anomaly covariate. By definition the time-mean anomaly for that period is zero. Sampling from a distribution with an anomaly more representative of today, or the near future, can offer a stress test that has accounted for a climate that has already changed. To see more clearly how climate change that occurred during that period directly impacts the annual losses, we can instead sample from the conditional distribution associated with specific non-zero anomalies. Choosing 2017 and 2024 as examples, the GSAT anomalies are 0.315°C and 0.665°C, respectively.
The example loss distributions are shown in Fig. 3, where the blue curve for a GSAT anomaly of zero is the same data as in Fig. 1. The positive anomalies, i.e. a warming GSAT, are clearly associated with increasing median and mean losses, as well as increased variability and volatility. Most importantly, defining the tails as anything above $288 Billion, which corresponds to the 99th percentile of the marginal (zero-anomaly) distribution, even more extreme annual costs are possible today.
Application to Bank Stress Testing
We have illustrated a simple approach that can be applied to construct useful and realistic physical climate risk stress testing. The illustration is based on an ad-hoc public database, but is easily extensible to portfolio exposure or sector exposure. It is also customizable to construct stress tests based on few or many hazards.
A challenge to using event costs directly to inform stress tests is that disambiguating all the cost contributors into impacts on a bank portfolio may not be possible. It would be tempting to apply a sampling strategy similar to what’s illustrated above to insurance claims records. But because not all losses that affect a portfolio are covered by insurance, that approach, by definition, results in an incomplete view of loss that a bank could incur.
Instead, stress on an individual institution is best estimated by applying the same concept to a portfolio of assets exposed to material risk, and sampling from hazard distributions to compute loss distributions on an asset-by-asset basis. This aligns with a bottom-up risk analysis approach based on sampling methods as illustrated here, and which can be done in practice with Jupiter data, which accounts for nonlinearity and nonstationarity in the changing climate. Tipping points can also be factored into a stress test, should a bank choose to include that as part of a hedging strategy. And, the full distributions of hazards can be used to construct probabilistic stress tests suitable for a complete risk analysis, by drawing multiple realizations.
In regions dominated by a small number, or even one, hazard, the same approach illustrated above can apply simply by reducing the hazards used in sampling. In any given year significant losses from even a single hazard can put much greater stress on insurance and banking books than an individual event can do alone. This may apply in small regions such as Singapore, for example.
While this is not the only way to construct a useful stress test that reflects good risk management practices, it is an easy one that is possible with available data on the market today. It’s also reasonably straightforward to assess uncertainty in the same framework. It addresses challenges discussed in a Milliman report from 2025 about managing climate risks, which points out that banks need to be aware of limitations in climate scenario analysis. It specifically notes limitations associated with nonlinearity (implying nonstationarity) and tipping points. The framework above, coupled with hazard data that accounts for nonstationarity and tipping points, can largely overcome these limitations as long as the underlying distributions include the effects of nonlinearity and tipping points. Those distributions are possible to construct, and relatively straightforward with rich data sources such as those provided by Jupiter.
This illustration ignores the reality that portfolio stress cannot be fully assessed without some understanding of how people will react to changing stress in their own lives, whether from direct climate change impacts or changes to regional economic conditions arising from climate change. In these relatively early days of learning resilience and adaptation to climate change, and without any comprehensive understanding of how humans will change systematic behavior, we have no choice but to ignore this for now.
A stress test for climate risk can be augmented with other economic stressors, such as a recession or applying likelihoods of geopolitical stresses. In the same way that climatic tipping points can increase the likelihood of another tipping point, climate stress can increase the likelihood of other economic stressors, as clearly reported by Hiebert and Monnin. While we may not yet have a complete understanding of those links, in the spirit of the stress test described here, we can form a useful test by layering these economic stressors on without assuming causality.
Climate stress testing remains an evolving field. Readers interested in discussing the underlying science, assumptions, or methodologies are encouraged to connect with Jupiter's climate science team. Talk to our team.
References
1 Based on discussions with Jupiter’s customers who participated in the U.S. Federal Reserve Bank stress test.
2 Paul Hieber and Pierre Monnin, A Macroprudential Approach to Compound Climate Risks, Policy Report, Center for Economic Transition Expertise, London School of Economics, Sept. 2025.
3 Kerry Emanuel, Physically Based Weather Hazard Modelling: Accounting for Climate Change, Journal of Catastrophe Risk and Resilience, 2023. 10.63024/nc7e-qd7t
4 https://www.ncei.noaa.gov/access/billions/
5 https://www.ncei.noaa.gov/access/monitoring/global-temperature-anomalies/
6 Now managed by Climate Central: https://www.climatecentral.org/climate-services/billion-dollar-disasters
