.webp)
.avif)
[EXTREME WEATHER]
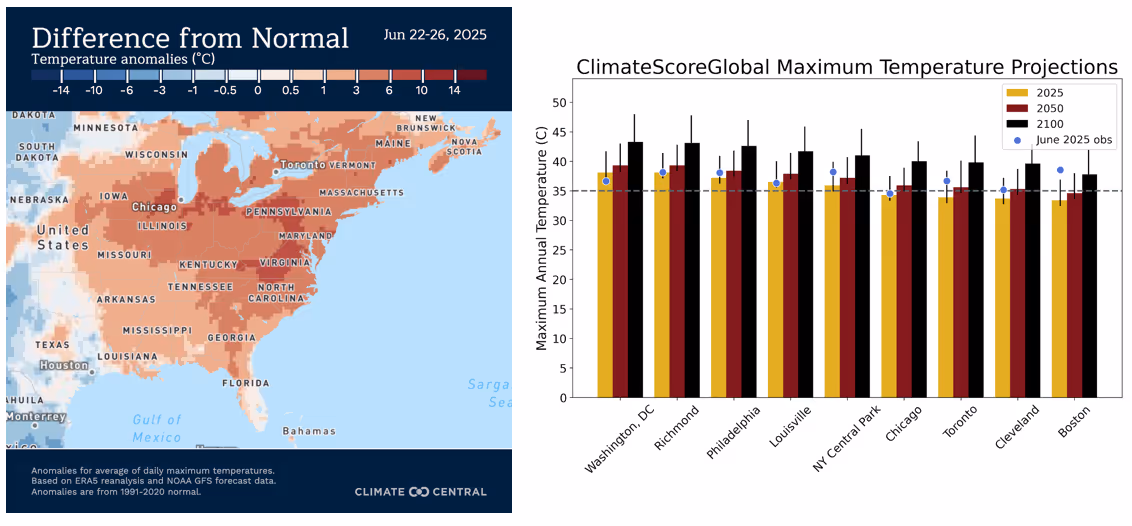
In late June 2025, an intense and early-season heatwave engulfed much of the northeastern United States and eastern Canada. From June 22–26, temperatures climbed dramatically above normal across a vast region. In major metro areas like New York, Boston, Toronto, and Washington D.C., thermometers soared past 35°C (95°F), a threshold still considered unusual for the Northeast in June.
But what stood out wasn't just the heat. It was how widespread, record-breaking, and climate-driven it was.
Over 100 weather stations across the eastern U.S. set new all-time temperature records for the month of June. According to Climate Central, more than 80 million people experienced daytime highs of 35°C or above, and more than 190 million endured nighttime lows above 21°C (70°F) – conditions that make it harder for the human body to recover from daytime heat stress, especially in homes without air conditioning.
Climate Central’s Climate Shift Index, which quantifies how much more likely an event is due to climate change, attributed a 2–5x greater likelihood to the temperatures observed during the heatwave.
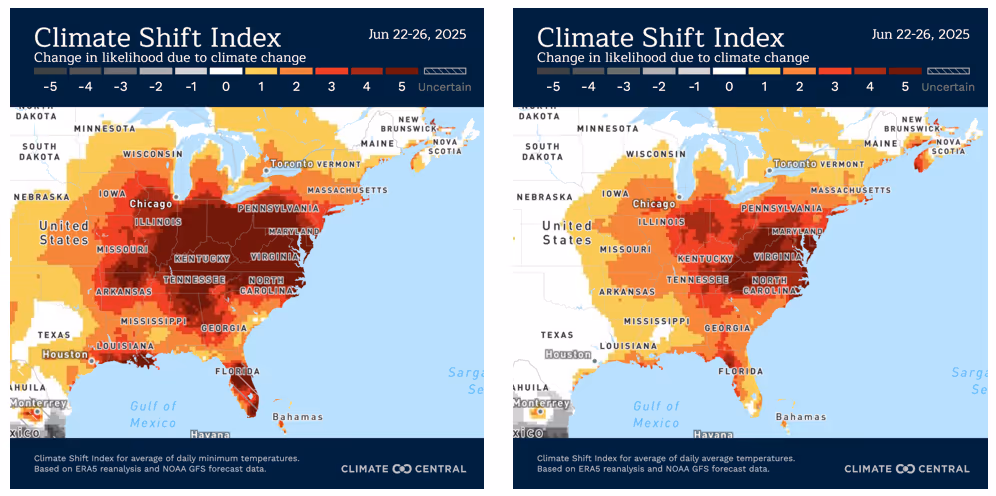
In other words, this wasn’t just summer being summer. It was summer, redefined by climate change.
Why This Heatwave Mattered More Than Most
Though the Northeast has experienced summer heatwaves before, what set this one apart were four interconnected dynamics:
- Early Season Timing: The event struck unusually early in the year. The first major heatwave of the season often has outsize health impacts because people’s bodies aren’t yet acclimatized. According to the U.S. EPA, the average heatwave season is now 70 days long – 20 days longer than in the 1990s.
- Extremely Warm Nights: More than 60 stations across the region tied or broke June records for highest daily minimum temperatures. High nighttime temperatures increase health risks, especially among vulnerable populations, and stress energy grids due to continuous demand for cooling.
- Energy Grid Disruption: During the event, tens of thousands lost power in southern Ontario and New York City, where Con Edison reported outages affecting over 12,000 customers. As temperatures rise and heat events lengthen, cooling demand is expected to spike. Climate models project a minimum of 2,000 additional kilowatt-hours (kWh) in cooling energy demand per year in many cities by 2100.
- Geographic Breadth: This wasn’t an isolated anomaly. The heat blanketed a vast swath of the continent, stressing infrastructure and emergency services across multiple regions simultaneously.

Business Risk and the Data Gap
Heatwaves like this are no longer edge cases. They are becoming core scenarios. For businesses with assets, employees, or customers in the Northeast, this June’s heatwave was more than a warning sign; it was a data point in a trendline.
Yet too many organizations still rely on historical weather data or incomplete projections to evaluate climate risk. That approach is increasingly inadequate. What’s needed is decision-grade, forward-looking data that reflects the intensifying frequency, duration, and geographic scope of extreme heat.
Understanding the magnitude of the risk is only half the equation. Decision-makers also need to know where and when these impacts are likely to occur, how they evolve under different climate pathways, and how those impacts affect physical infrastructure, operational continuity, and financial outcomes.
Using Science to Stay Ahead
This is where scientifically rigorous tools like Jupiter’s ClimateScore™ Global offer critical value. It projects future climate extremes including heat, flooding, wind, and wildfire at a hyper-local level through the year 2100, using the latest de-biased climate models. It translates those projections into business-relevant metrics like increased cooling demand, asset-level exposure, and operational risk.
During the June 2025 heatwave, for instance, actual maximum temperatures in several northeastern cities aligned with the high-end projections for 2025 under a high-emissions scenario in ClimateScore Global. In many areas, observed temperatures approached or exceeded the 95th percentile of model forecasts.
Looking further ahead, ClimateScore Global data shows that by 2050, 35°C (95°F) annual maximums are expected to become the norm in most northeastern cities. By 2100, those maximums will likely be exceeded regularly, even under moderate emissions scenarios.
For organizations trying to plan capital investments, ensure workforce safety, meet ESG disclosure requirements, or stress test operations, knowing what climate risks could look like isn’t enough. They need to know what’s likely – and they need to know it now.
Planning for a New Normal
The June 2025 heatwave was not the worst we’ve ever seen. But it may have been one of the most consequential, because it shows us what the new normal looks like before we’ve fully adapted to it.
If your organization has not yet integrated forward-looking climate data into its enterprise risk framework, portfolio strategy, or resilience planning, it may already be falling behind. The climate isn’t waiting.
To learn how organizations are using Jupiter’s climate intelligence to move from reactive recovery to proactive resilience, contact us here.
This article was written with support from Climate Central, a non-profit science and news organization providing authoritative information to help the public and policymakers make sound decisions about climate and energy.
