.webp)
.jpg)
In our first two articles in this series, we established the rigorous Jupiter verification and validation (V&V) process and why it matters, and showed how we put it into practice with the Jupiter wildfire model. In this article, we explore V&V for the Jupiter wind model. We explain how we built the model, how we ensure its fidelity, and how it holds up against real-world extreme wind scenarios, such as tropical cyclones and wind storms.
Extreme Winds: A Growing and Costly Physical Hazard
Extreme winds have been a major and still-growing contributor to damages and losses from physical risk. High winds from severe convective storms1, tropical cyclones2, 3, and intense winter windstorms4, 5 have been responsible for billions in annual damages and losses. Extreme winds can also compound other natural hazards; for example, hot, dry, and windy days provide conditions for wildfires to form and spread rapidly; and strong winds can amplify storm surge and coastal flooding.
Despite the cost of damaging winds, attempts to characterize how extreme winds change in a changing climate have been limited. And while the extreme wind risk posed by tropical cyclones has been well-studied, much is still unknown about how extreme winds from other phenomena may change in a warming world, and understanding extreme wind risk presents several major challenges:
- Effectively modeling extreme winds is difficult, especially for global climate models. Good wind risk modeling requires accurate and detailed terrain and built environment models in addition to high spatial resolutions. Global climate models, by nature, struggle to incorporate these high-resolution features on their native lower-resolution grids.
- Extreme winds come from many different types of weather systems. Extreme winds can arise from many different weather systems, including severe convective storms, tropical cyclones, and winter storms, with local geography such as mountains further shaping wind behavior. These systems don't necessarily respond to a warming atmosphere in the same way, nor behave consistently across the globe.
- High natural variability in extreme winds. Natural variability in wind speeds is high, meaning it can be difficult to determine which changes are a response to human-caused warming, versus changes that are simply typical fluctuations of the atmosphere.
- The human environment shapes damage and loss. Much of the increase in wind damage and loss has been attributed to exposure growth – that is, the continuing expansion of people and structures into at-risk areas. Indeed, for severe convective storms, over 80% of the rise in damage and loss has been attributed to growth in exposure rather than physical environmental changes6. And human factors, such as changes in land use and coverage7, and expansion of the built environment 8 can have significant impacts on local extreme winds.
For these reasons, it is difficult to develop a consensus view of how extreme winds may change as the planet warms. However, scientists have provided key insights on certain aspects of changes in extreme winds on a warming planet.
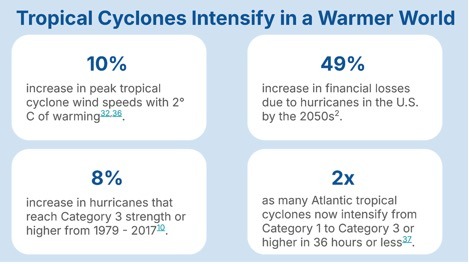
The strongest tropical cyclones will likely get stronger. For many tropical and coastal regions, tropical cyclones provide the primary exposure to extreme winds. While many aspects of changes in tropical cyclone behavior are still being studied, scientists are confident that atmospheric and oceanic warming has strengthened their strongest winds9, 10. As the ocean warms, there is more energy available for a tropical cyclone, meaning that the peak wind speeds that a storm can reach also increase11. For example, multiple separate studies estimated that the peak winds of 2024’s Hurricane Milton were 8 to 11 miles per hour stronger due to climate change9, 12. Warm oceans are also likely causing tropical cyclones to strengthen more quickly –- a characteristic that makes them both difficult to forecast and ultimately, more destructive13. Tropical cyclone experts have also noted that the fraction of tropical cyclones that reach major hurricane strength (Category 3 on the Saffir-Simpson scale, or peak winds of 111 mph or greater) has increased in recent years14. Overall, it’s clear that the wind speeds in the strongest tropical cyclones have already become even stronger and will continue to strengthen as the oceans and atmosphere continue to warm.
Some of Europe’s most destructive wind storms may move north. Scientists have established that the areas that most commonly see winter extratropical storms (that is, storms that are not tropical cyclones) have been shifting towards the poles: north in the Northern Hemisphere and south in the Southern Hemisphere15. If winter storms continue to move toward the poles, places that are toward the southern end of the storm zone could see their extreme wind risk decrease, while places on the northern end could see their wind risk increase16, 17. For Europe, this would mean that locations near the Mediterranean and central Europe could see wind risk decrease, while more northern locations – especially those north of 55°N – could see an increase in wind exposure. Scientists caution that confidence in these predictions is still low, and more study is needed. Even in areas where wind risk might decrease, the precipitation risk from these winter storms will almost certainly increase, with as much as 10% more rain falling from a given storm in the future16.
There is little agreement in predicting changes in the strength and number of extratropical storms. Broadly speaking, global climate models have predicted a decrease in the number of winter storms, at least in the Northern Hemisphere, though the strongest storms may get stronger18. Confidence in these results is low, with different models showing different results and highly region-specific changes. Outside of Europe, the winter storms known as nor’easters that bring heavy snows and extreme winds to northeastern North America have had stronger winds since 194019, but scientists are unsure whether this trend will continue.
Changes in global wind speeds outside of storms are small and show little consensus. The Intergovernmental Panel on Climate Change’s 6th Assessment Report found that wind speeds over land have likely decreased, especially in the Northern Hemisphere; data and model limitations mean that confidence in these results is low15. Even downscaled wind speeds show little significance in trends, with large variability across even the same climate model20. Wind speeds over oceans have generally strengthened, and wind speeds in the sub-Arctic latitudes may increase21. Climate models show substantial disagreement on these changes, and further study is needed.
How Jupiter Models Wind Risk
Global climate model (GCM) simulations, reanalysis, weather station observations, and tropical cyclone datasets form the backbone of Jupiter’s wind risk modeling and are fused to create estimates of extreme, near-surface wind events that could damage or destroy property. Wind risk is predicted for near-surface winds (approximately 10 meters (33 feet) above the ground). Jupiter predicts both acute (extreme) wind events as well as chronic wind events. Extreme wind metrics are defined using daily maximum 1-minute sustained wind speeds, while chronic wind metrics are annual average and maximum wind speeds. Jupiter’s extreme wind speed estimates are created from statistical and machine-learning modeling of annual maximum wind speeds at locations across the globe, and wind speeds are estimated for a variety of return periods, detailed in Table 1. Most damages and losses are attributed to extreme wind events.

Jupiter’s wind risk model differentiates between tropical cyclones (TC) and non-TC winds because TCs are the primary driver of extreme wind speeds in regions prone to such events. However, modeling TCs introduces distinct and specific challenges that must be carefully addressed to generate a complete and accurate estimate of overall wind risk.
Modeling the Hardest Case: Tropical Cyclone Winds
Estimating tropical cyclone winds presents specific technical challenges for wind risk modeling, including:
- Tropical cyclones are rare. While tropical cyclones form somewhere every year, the probability that a tropical cyclone impacts a specific location in any given year is low.
- Tropical cyclones have a (relatively) short observational record. While tropical cyclones have been known to human societies for centuries, reliable observations of TCs have been available for only a relatively short period of time.
- Tropical cyclones are too small to be simulated directly in climate models. The global climate models (GCMs) that make projections about weather and climate are typically too low-resolution to directly model tropical cyclones (though they can and do model the background conditions that affect how they form and grow).
Jupiter uses synthetic tropical cyclone data to address these challenges and fully estimate tropical cyclone wind risk. While these computer-generated hypothetical tropical cyclones follow the laws of physics, they did not actually happen in the real world. Using large numbers of synthetic storms is a well-established practice, critical for risk assessment: a location that has not been hit by a tropical cyclone in the recorded past doesn't inherently have low exposure to TCs22, 23. Synthetic storms help capture that risk, which the historical record alone would miss.
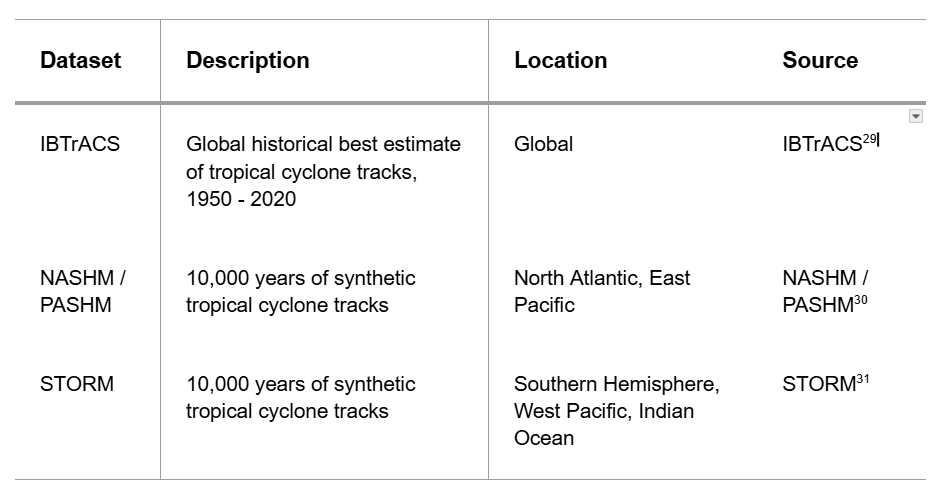
For historical simulations, Jupiter estimates tropical cyclone wind risk using the synthetic tracks in addition to the best estimates of historical tracks (Table 2). For each tropical cyclone basin, a total of 20,000 potential synthetic events are selected for each region (see Table 2). Along these track locations, Jupiter models a full tropical cyclone surface wind speed field24-26, with additional adjustments to account for surface friction and terrain impacts27, 28.
Understanding how tropical cyclones will change in a warmer climate is an active and ongoing area of research. Scientists know that warmer oceans and a warmer atmosphere will help make the strongest tropical cyclones have even stronger winds32, 33. Jupiter’s wind model incorporates GCM-projected changes in the environmental conditions that can impact tropical cyclone strength: such as ocean temperatures, background winds, and atmospheric moisture. But other aspects of tropical cyclone behavior are less understood: where they form, how often, how fast and in what direction they move, and how they interact with the rest of the atmosphere34, 35. For now, Jupiter’s wind model does not account for changes in these aspects of tropical cyclone behavior, though this may change in the future as new scientific evidence and consensus emerges.
To project future wind strength, Jupiter applies historical synthetic distributions to GCM-projected future environments using a statistical-dynamical intensity model 38-40, an approach commonly used in operational tropical meteorology. Jupiter’s intensity model includes environmental predictors related to background air and ocean temperatures, winds, and humidity; predictors related to the tropical cyclone itself, such as the motion and the location; and its characteristics in the previous 6 hours. Jupiter’s climate-scaled intensity model was evaluated on non-included tropical cyclones between 2013 and 2019, and was found to have an average intensity error of 10.4 kt, which is comparable to the average error in operational statistical-dynamical forecast models42.
Modeling Wind Risk Beyond Tropical Cyclones
To evaluate global non-tropical cyclone wind risk, Jupiter’s wind model incorporates daily maximum near-surface wind speeds from GCMs blended with historical reanalysis, and weather stations. Jupiter bias corrects the GCM inputs with historical analysis43 and computes extreme wind metrics (Table 1) and annual maximum wind speeds using Extreme Value Theory.
Jupiter further refines extreme wind speeds using an enhanced downscaling machine learning model that incorporates station network data (Table 3). To address variations in station location, measurement heights, and averaging periods, Jupiter standardizes observations to a 1-minute daily maximum wind speed at 10 meters above ground per World Meteorological Organization guidelines44. Stations with differing measurement periods45, 46 or heights47 are scaled using established conventions. Stations must possess at least 20 years of data and include at least 90% of days in each year. A total of 5,360 global wind observation locations meet these criteria.

Merging the Two Models Into One Wind Risk Estimate
After the enhanced downscaling is applied to the non-TC wind model, the tropical cyclone wind model is interpolated to a common grid, and the return periods for the extreme peril metrics are calculated using Extreme Value Theory. Extreme peril metrics are calculated separately for the non-TC and TC wind models in locations with both TC and non-TC exposure and are blended to create a final wind risk estimate. Locations that do not have TC exposure use the non-TC wind risk estimate directly.

Figure 1 highlights the importance of the separate TC model. For the locations along the Gulf Coast, the non-TC wind speed model, which is based only on historical winds, does not fully capture the possible extreme winds along the coast (left panel). The TC model provides a more robust estimate of extreme wind risk along the coast (center panel) but provides lower risk estimates for interior regions. By combining the two models, the TC model provides a better assessment of the wind risk presented by tropical cyclone winds for coastal regions, while the wind risk for interior locations is better captured by the non-TC wind model (right panel). The merged wind model includes the strengths of both wind models to provide the most physically accurate, location-specific wind risk estimates.
Verifying the Model: Checking for Internal Consistency
The verification process is the quality control steps within the peril production pipeline at Jupiter. Verification performed on Jupiter model output ensures that the model outputs are reliable, realistic, and physically consistent. Each peril has its own specific verification pipeline that includes software engineering controls, expert examination of outputs, and checking against external data when possible. Verification is done for each peril, scenario, and epoch (see epoch definitions in Figure 2).

At Jupiter, the product assessment process incorporates a variety of technical and cross-level checks. During verification, Jupiter’s wind risk experts inspect the results throughout the process, and ensure that they are reasonable, accurate, and reflect the current state of meteorological science. For the Jupiter wind model, the rigorous tests we use to create a Jupiter Quality Score (JQS) include:
- Verifying raw metric values and ensuring these values are physically reasonable. All wind values from any return period metric, including upper and lower uncertainty bounds, are flagged if they are outside of a 1 to 127 m/s (284 mph) range. We do not expect any area to have no wind at all (thus, the minimum value of 1 m/s). The maximum observed wind speeds in tropical cyclones are around 100 m/s (224 mph)52. Since the highest wind speeds in the most intense tropical cyclones could increase in the future10, 33, we set the maximum wind speed to 127 m/s (284 mph) to account for this.
- Calculating an uncertainty range. An uncertainty bound that is less than zero or greater than 50 m/s (112 mph) is flagged for further review.
- Checking the difference across return periods. Maximum wind speeds for a 500-year return period should be larger than maximum wind speeds for a 200-year return period. Return periods can differ by a maximum of 115 m/s (257 mph) to account for large differences in recurrence intervals in areas of very strong extreme wind speeds.
- Checking the difference across consecutive years. Climate scientists expect that extreme wind speeds not associated with tropical cyclones change by less than 5% 53, 54, 55. Thus, 5-year trends that exceed ± 15 m/s (33.5 mph) are flagged for further review.
- Checking the deviation from the year-to-year trend. For wind speeds, we do not expect the trends to vary widely from one year to another. For each metric at each location, a maximum deviation from the year-to-year trend in wind speed that is greater than 4 m/s (9 mph) is flagged for further review.
- Ensuring values vary smoothly in space. We expect that neighboring locations will have similar values of average annual wind speed and maximum annual wind speed. If the maximum difference from adjacent grid points is greater than 5 m/s (11 mph), that grid point is flagged for further review.
- Missing data. Wind metrics are checked to ensure that there is no unexpected missing data, and that metrics exist consistently for all forecast years at all locations.
These Jupiter Quality Score tests are performed for all wind metrics at all locations, for all years and all emissions scenarios (Figure 3), and the final JQS is created by averaging the wind model results across metrics and years within an epoch, and for all locations within a region. A JQS of at least 50 is considered a good score. For Jupiter’s wind model, the JQS is 100 for all regions in all epochs, indicating that the wind metrics pass all JQS tests for every location in every region (Table 4). We note that this should not be interpreted as a perfect model; instead, it simply means that the wind model passed Jupiter’s quality control tests described above at each location, in each epoch, for each scenario.

Validating the Model Against the Real World
Once Jupiter’s wind model has been successfully verified, the validation process can begin. For the wind model, the goal of the validation process is to ensure that the Jupiter wind model is accurately predicting high wind risk in areas that have seen high wind risk and wind damages in the real world. We compare Jupiter’s wind model to wind risk estimated from ERA5 reanalysis data, and further analyze extreme winds associated with tropical cyclones, winter storms, and local topography.
High resolution wind models shine in complex terrain
Jupiter’s wind model and ERA5 winds were both compared to estimates from a held-out set of observations from 529 global weather stations. For a 100-year wind event, Jupiter’s wind model exhibited a very low bias, with a median error of +0.31% in estimating 100-year wind speeds. ERA5, on the other hand, consistently underestimated wind speeds, with a median percent error of -6.35%. The magnitude of the Jupiter wind model’s median percent error was 9.19%, while ERA5’s error exhibited a median magnitude of 17.95% -- nearly twice that of Jupiter’s model. Overall, the Jupiter wind model has a substantially lower error, with an order of magnitude lower bias, when compared to ERA5 reanalysis.

Figure 3 provides an illustration of this bias in action. The enhanced downscaling in Jupiter’s wind model captures the local, small-scale influences on extreme winds, improving estimates of wind risk compared to the coarser ERA5. In Figure 3, Jupiter’s wind model is better able to model the extreme wind speeds often seen in areas like the Colorado Rockies, where complex topography and mountainous terrain are highly influential on extreme wind speeds. ERA-5’s lower resolution limits its predictions of extreme wind speeds to 100 miles per hour (45 m/s) or less. In a region where seasonal wind storms regularly exceed 100 mph (a December 2025 wind storm recorded wind speeds of 112 mph, or 50 m/s56), and the highest verified recorded wind speed is 148 mph (66 m/s)57, the high-resolution Jupiter wind model provides a substantially improved wind risk estimate.
Global Validation: Accurate Estimates of Extreme Winds
While ERA5 provides global wind speed estimates, its coarse resolution means that wind speed estimates are often lower than what is observed at local weather stations, which provide true observational estimates of wind speeds. Thus, our next step in our validation process is to compare the Jupiter wind model to wind speeds observed at global weather stations. Thus, we compare observations from 5,346 global weather stations to the Jupiter wind model’s wind risk estimates for these locations. We use observations covering 1950 - 2010 from 5,346 global weather stations; stations must have 20 years of continuous data, with at least 90% of observations per year, to be included. Note that individual stations can have station records as long as 61 years, spanning the entire period; or as short as the 20-year minimum record length. These weather station observations have been subjected to Jupiter’s internal quality control processes, but not the enhanced downscaling. Jupiter return periods are estimated from the Baseline epoch (Figure 3), and both modeled and observed return periods are estimated using Extreme Value Theory.

When we compare the maximum observed wind speed at each station to Jupiter’s estimated return periods (Figure 4), we see that Jupiter’s return periods provide a reasonable estimate of extreme winds for these stations. Statistically, in a network of stations with 61 years of data, we’d expect virtually all stations to experience an extreme wind event corresponding to a 10-year return period or greater. Most stations do not have 61 years of data. About 23% of stations have 50 years or more, while about half of our global weather stations have fewer than 40 years of data. If we assume each station records only the minimum 20 years of data, we’d expect about 86% of stations to experience extreme winds, while nearly 14% of stations would not experience an extreme wind event. We also note that locations that did not experience extreme winds as defined by Jupiter’s wind model had, on average, 10 fewer years of observations compared to locations that did experience extreme winds; and these locations were also disproportionately likely to be located in the tropics or Southern Hemisphere, where observational coverage is lacking compared to the Northern Hemisphere midlatitudes (see Figure 5).

Tropical Cyclone Validation: Capturing Risk From Major Storms
The National Hurricane Center (NHC) estimates of major hurricane return periods58 are compared to Jupiter estimates of major hurricane return periods for East Coast and Gulf Coast U.S. locations. The NHC methods and the Jupiter wind estimates are slightly different; for example, the NHC estimates are primarily derived from historical observed storms, while the Jupiter estimates are computed using synthetic storms (see Table 2). Despite some differences in wind modeling, Jupiter’s major hurricane return periods and those of the NHC are quite consistent, as seen in Figure 6. Along the Texas Gulf Coast, the NHC estimates major hurricanes to have a 23-32 and 33-52 year return period, while Jupiter estimates that major hurricanes have a 33-52 year return period in this region. In South Florida, Jupiter estimates major hurricanes to have a 23-32 and 33-52 year return period, while the NHC estimates a slightly lower return period of 14-33 years over much of the region. In New England, both Jupiter’s wind model and the NHC identify a lower frequency of major hurricanes, with both models estimating that much of the region has a 53-120 year return period for major hurricanes.

Why out of sample testing matters: Capturing risk from unseen hurricanes
We’ve seen that the Jupiter wind model’s estimates of major hurricane return periods for the eastern United States compare well to the estimates compiled by the National Hurricane Center. But tropical cyclone behavior is changing quickly, and we want to ensure that Jupiter’s wind model can successfully identify the risk posed by major hurricanes. (Note: while weaker hurricanes and tropical storms can still be responsible for extreme rainfall, their wind speeds are by definition less remarkable).
We compare Jupiter’s wind model to North Atlantic tropical storm strength or greater from 2017 to 2025 from the IBTrACS dataset (see Table 2). We choose storms from the North Atlantic because the National Hurricane Center’s definition of maximum wind speed most closely matches the Jupiter wind model definition59; and the period from 2017 to 2025 falls firmly outside the baseline period that Jupiter’s wind model was trained on. We select only hurricane tracks within 100 km (61 miles) of land, and match hurricane tracks to our high-quality global weather observation stations network within 75 km from the center of the hurricane track. These stations should be comfortably within the hurricane winds, and reasonably close to the strong winds at the center of the hurricane. For each tropical cyclone, we compare the maximum observed wind speed to the Jupiter return periods estimated for that station.
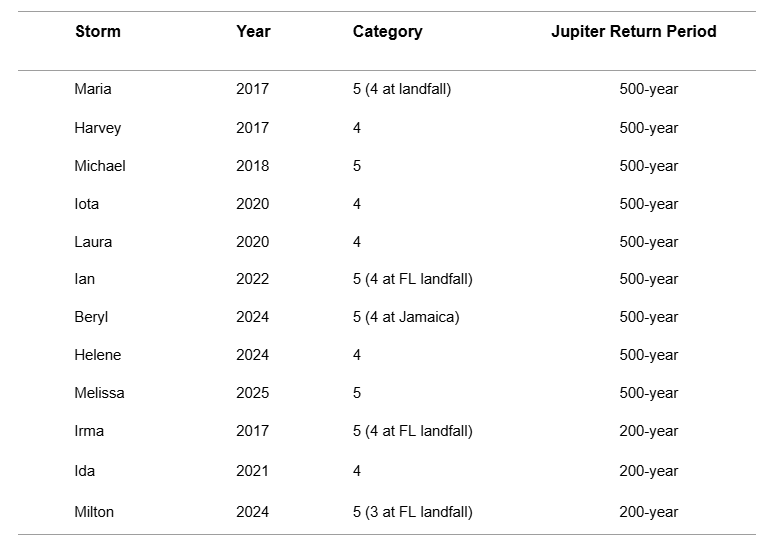
Overall, we analyzed 91 Atlantic tropical cyclones that made landfall and reached at least tropical storm strength from 2017 - 2025. Jupiter’s wind model identified nearly all of the landfalling storms that reached Category 4 or 5 strength during this period as 200-year or 500-year events (Table 5). Table 5 is missing one notable storm: 2019’s Hurricane Dorian, which was the strongest Atlantic storm ever until 2025’s Hurricane Melissa60. While Dorian was catastrophic for the Bahamas, there was not a weather station that passed Jupiter’s quality control process and was located within 75 km of Dorian’s track at landfall in the Bahamas. The stations used for Hurricane Dorian were in Puerto Rico and North Carolina, where Dorian’s intensity was much lower.
The Model in Action: Hurricane Harvey
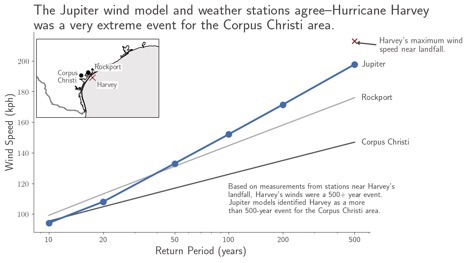
We take a closer look at Jupiter’s wind risk estimations for Hurricane Harvey. While Harvey is best-known for the long-lasting and catastrophic flooding it brought to the Houston area, it actually made landfall near Corpus Christi, TX, as a Category 4 storm. We compared Jupiter’s estimated extreme wind return periods for the Corpus Christi area to extreme wind return periods estimated from local weather stations.
We identified two local weather stations: Corpus Christi Airport (CRP), and Rockport Airport (RKP), with sufficiently long records and reliable wind speed observations as part of the Automated Surface Observing System (ASOS)61. We estimated extreme wind return periods at these stations using hourly observations of maximum wind speed from 1970 - 2020 (1984 - 2020 for Rockport). We note that while the ASOS weather station observations are generally high quality, routinely maintained, and undergo some quality control, they do not undergo Jupiter’s additional quality control steps. In Figure 7, we can see that Jupiter and both weather stations all identified the Category 4 Hurricane Harvey as a 500-year event for the Corpus Christi area. While Hurricane Harvey’s wind speeds at landfall were above the mean 500-year wind speed estimate, Harvey’s wind speeds fall within the Jupiter wind model’s uncertainty bounds.
The Model in Action: Japanese Typhoons
Across the Pacific, we also analyze the Jupiter wind model’s performance on recent West Pacific storms. The typhoons of the northwestern Pacific Ocean are the strongest on Earth, with the strongest storms reaching wind speeds in excess of 150 mph (240 km/h). Countries like Taiwan and Japan see the impacts of anywhere from 5 to over 20 typhoons per year. In Japan, records of typhoons impacting the nation go back as early as the 9th century, and typhoons are even credited for keeping the Mongols from conquering Japan in the 13th century62. To ensure that the Jupiter wind model can adequately represent global tropical cyclone risk, we also assess the model’s performance against two recent strong typhoons that impacted Japan. We looked at two different regions in Japan: the island of Okinawa, which is the most at-risk area of Japan when it comes to tropical cyclones; and Kyushu, the southernmost island in mainland Japan. We used long-standing weather observation stations at Okinawa (ROAH) and Miyazaki (RJFM)61 to examine the impacts of 2023’s Typhoon Khanun and 2024’s Typhoon Shanshan, respectively. Both typhoons struck as Category 4 equivalents, with wind speeds at landfall nearing 175 km/h (109 mph), just short of the Japanese Meteorological Agency’s threshold for a supertyphoon.

In Okinawa, even a strong typhoon like Khanun is a 50-75 year event. Jupiter’s wind model estimated Khanun as being approximately a 1 in 50-year event (2% chance of occurring in a given year), while the records from the Okinawa weather station had it as being slightly rarer, at 1 in 75 years (1.3% chance of occurring in a given year). Both Jupiter’s wind model and the observational data indicate that there’s a greater than 1% chance of such a storm impacting the island in a given year. As Okinawa is one of the most typhoon-struck places on Earth, residing in the so-called Typhoon Alley, this somewhat high frequency of even strong typhoon impacts is not surprising. Despite Okinawa’s frequent typhoons, strong typhoons still deliver a punch, with Khanun’s winds downing power lines and leaving over 25% of Okinawa and its neighboring islands in the dark for multiple days63.
For Miyazaki, on the southern end of Kyushu, a strong typhoon impact is considerably less common. 2024’s Typhoon Shanshan brought nearly 800 mm of rain to Miyazaki in just two days, and hundreds of buildings were damaged by the strong winds64. Both the Miyazaki weather station and Jupiter’s wind model identified Shanshan as a very rare event for the city of Miyazaki, with winds like Shanshan’s expected once every 350 to 500 years.
Non-Tropical Cyclone Validation: Exposure in At-Risk Areas like France
For areas that don’t experience material tropical cyclone threats, the biggest wind risk threats come from other types of weather systems. In Europe, one of the most wind-threatened regions in the world, extreme winds often accompany extratropical cyclones, or winter storms. These windstorms damage natural and human environments, harm forestry and agricultural operations, and lead to high insured and total losses. In 2022, Europe saw a total of $5.7 billion in insured losses, with over $4 billion of that total coming from a single storm, Ylenia-Zeynep-Antonia65. Improving wind risk modeling is therefore a top physical hazard priority for Europe. And Europe is not the only region that suffers from non-tropical cyclone winds. Northeastern North America also sees major impacts from severe winter storms, known as nor’easters. While damages from these storms also include coastal flooding and heavy snow, winds are responsible for much of the damages and losses, which can reach $20 billion for some of the strongest storms19.

We evaluate the performance of Jupiter’s wind model against a database of observed destructive European wind storms. We use the CLIMK–WINDS Wind Storm Database5, which provides footprints and maximum wind estimates for Europe’s 50 most destructive wind storms between 1995 and 2015. We focus on the period 2005 to 2015 to minimize overlap with the Jupiter wind model’s baseline period. We narrow our focus to explore extreme wind storms in France, due to the proliferation of high-quality and widespread Météo-France station data. We compare the maximum observed wind speeds for each station location from the CLIMK-WINDS database to extreme wind return period estimates in the Jupiter wind model. We analyze the extreme wind speeds from a total of 21 different wind storms over this 10-year period, and use the maximum wind speed at each station as our highest observed wind speed.
In Figure 9, we see how the strongest observed winds during extreme windstorms over this time period compare with the Jupiter estimates of extreme wind return periods. Of our nearly 300 weather stations, over 80% of stations experienced at least a 10-year extreme wind event during this time period. 4.8% of weather stations, mostly on France’s west coast, saw extreme winds corresponding to a 500-year or more event. While these probabilities are a little bit higher than what we’d expect based on statistics alone, we note that our individual stations are not fully independent observations. That is, if one station experiences extreme winds (especially from a large-scale weather event like a wind storm), it is likely that a station 10 km away will also experience extreme winds.
We again take a closer look at a specific storm in Figure 10. Winter Storm Joachim (left) brought extreme winds to southwestern France and Brittany. Joachim’s winds left over 400,000 households without power in France alone, disrupted road and rail traffic, and caused a freighter to run aground in Brittany66. Joachim’s maximum winds exceed 150 km/hr (93 mph) in some locations. We compared Jupiter’s estimated extreme wind return periods to extreme wind return periods estimated from local weather stations in Brittany.
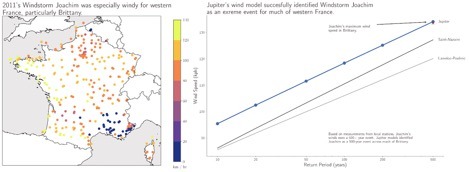
We identified two local weather stations: Saint-Nazaire (LFRZ), and Lanvéoc-Poulmic Naval Air Base (LFRL), with sufficiently long records in the Automated Surface Observing System (ASOS)61. We estimated extreme wind return periods at these stations using hourly observations from 1950 to 2025. Figure 10 shows that both the Jupiter wind model and the local weather stations identified Storm Joachim as a 500-year event.
The Human and Physical Limits of Wind Modeling
Jupiter’s advanced extreme wind model is successfully able to model wind risk from both tropical cyclone hazards, and non-tropical cyclone threats such as winter wind storms. The Jupiter wind model improves extreme wind modeling with high-resolution topography, correctly identifies major tropical cyclone hazards, including from recent storms, and correctly models extreme winds from European windstorms.
Understanding extreme winds and climate change is very much an evolving field. Many potential changes in extreme wind exposure are under active study and debate by scientists, with low confidence in trends. Currently, the Jupiter wind model does not consider changes in the frequency, locations, or movement speeds of tropical cyclones, though as scientific consensus evolves, that may change. Furthermore, extreme wind exposure depends heavily on the built environment, and land use changes. While the Jupiter wind model does account for land use and land cover in its models, these factors change very quickly in real time.
Wind risk is evolving unevenly; strengthening at the top end of tropical cyclones, shifting poleward for European windstorms, and still resisting consensus almost everywhere else. The Jupiter wind model is built to work within that uncertainty: validated against major hurricanes and windstorms it was never trained on, built to resolve the local terrain and coastal effects that coarser models miss, and explicit about where the science itself is still unsettled, such as future changes in tropical cyclone frequency and movement.
For risk professionals, that means a wind risk assessment grounded in what has actually been observed and verified; and equally, in honesty about what remains an active area of research.
References
- Swiss Re, 19 March 2026: Wildfires, storms, floods contribute to record 92% of global insured losses in 2025, says Swiss Re Institute. Accessed June 2026.
- Lin, C.-Y., and E.J. Cha, 2025: Evaluating the impact of climate change on hurricane wind risk: A machine learning approach. Risk Analysis, 45, 4378-4396.
- Moody’s Analytics, 6 November 2025: Moody’s RMS Event Response estimates insured losses from Hurricane Melissa to range between US$3 billion and US$5 billion. Accessed June 2026.
- Swiss Re, 23 January 2024: Winter storms: Natural catastrophes in focus | Swiss Re. Accessed June 2026.
- Flynn, C.M., et al., 2025: CLIMK–WINDS: a new database of extreme European winter windstorms. Earth System Science Data, 17, 4431 - 4453.
- Aon, 11 September 2023: Rising Losses From Severe Convection Storms Mostly Explained by Exposure Growth. Accessed June 2026.
- Hansen, M., and C. Hanson, 2026: Land Use Changed the Climate. Now Climate’s Changing the Land. World Resources Institute, 13 January 2026.
- De Martin, F., A. Zonato, and S. Di Sabatino, 2025: Effects of the urban land use on a severe convective windstorm. Quart. J. Roy. Meteorol. Soc., 151, e5058.
- Gilford, D.M., J. Giguere, and A.J. Pershing, 2024: Human-caused ocean warming has intensified recent hurricanes. Environmental Research: Climate, 3, 045019.
- Emanuel, K., 2020: Evidence that hurricanes are getting stronger. Proc. Nat. Acad. Sciences, 117, 13194 - 13195.
- Emanuel, K.A., 1988: The Maximum Intensity of Hurricanes. J. Atmos. Sci., 45, 1143 - 1155.
- World Weather Attribution, 11 October 2024: Yet another hurricane wetter, windier and more destructive because of climate change. Accessed June 2026.
- Hong, J., and Q. Wu, 2021: Modulation of global sea surface temperature on tropical cyclone rapid intensification frequency. Environmental Research Communications, 3, 041001.
- Kossin, J.P., et al., 2020: Global increase in major tropical cyclone exceedance probability over the past four decades. Proc. Nat. Acad. Sci., 117, 11975-11980.
- Gulev, S.K., et al., 2021: Chapter 2: Changing State of the Climate System. In Climate Change 2021: The Physical Science Basis. Contribution of Working Group I to the Sixth Assessment Report of the Intergovernmental Panel on Climate Change [Masson-Delmotte, V., et al. (eds.)]. Cambridge University Press, Cambridge, United Kingdom and New York, NY, USA, pp. 287–422, doi: 10.1017/9781009157896.004.
- Lee, J.-Y., et al., 2021: Chapter 4: Future Global Climate: Scenario-based Projections and Near-term Information. In Climate Change 2021: The Physical Science Basis. Contribution of Working Group I to the Sixth Assessment Report of the Intergovernmental Panel on Climate Change [Masson-Delmotte, V., et al. (eds.)]. Cambridge University Press, Cambridge, United Kingdom and New York, NY, USA, pp. 553–672, doi: 10.1017/9781009157896.006.
- Barcikowska, M.J., et al., 2018: Euro-Atlantic winter storminess and precipitation extremes under 1.5 °C vs. 2 °C warming scenarios. Earth System Dynamics, 9, 676-699.
- Seiler, C., and F.W. Zwiers, 2015: How will climate change affect explosive cyclones in the extratropics of the Northern Hemisphere? Climate Dynamics, 46, 3633 - 3644.
- Chen, K., et al., 2025: The intensification of the strongest nor’easters. Proc. Nat. Acad. Sciences, 122, e2510029122.
- Jong, D.I., and L. Shushama, 2019: Projected Changes to Mean and Extreme Surface Wind Speeds for North America Based on Regional Climate Model Simulations. Atmosphere, 10, 497.
- Krieger, D., and R. Weisse, 2026: CMIP6 multi-model assessment of Northeast Atlantic and German Bight storm activity. Earth System Dynamics, 17, doi:10.5194/esd-17-1-2026.
- Vickery, P.J., P.F. Skerlj, and L.A. Twisdale, 2000: Simulation of Hurricane Risk in the U.S. Using Empirical Track Model. J. Structural Engineering, 126, doi:10.1061/(ASCE)0733-9445(2000)126:10(1222).
- Emanuel, K., et al., 2006: A Statistical Deterministic Approach to Hurricane Risk Assessment. Bull. Amer. Meteorol. Soc., 87, 299 - 314.
- Holland, G.J., 1980: An analytic model of the wind and pressure profiles in hurricanes. Mon. Weather Rev., 108, 1212-1218.
- Willoughby, H.E., R.W.R. Darling, and M.E. Rahn, 2006: Parametric Representation of the Primary Hurricane Vortex. Part II: A New Family of Sectionally Continuous Profiles. Bull. Amer. Meteorol. Soc., 134, 1102 - 1120.
- Chavas, D.R., N. Lin, and K. Emanuel, 2015: A Model for the Complete Radial Structure of the Tropical Cyclone Wind Field. Part I: Comparison with Observed Structure. J. Atmos. Sci., 72, 3647-3662.
- Kipert, J., 2001: The Dynamics of Boundary Layer Jets within the Tropical Cyclone Core. Part I: Linear Theory. J. Atmos. Sci., 58, 2469 - 2484.
- Kepert, J., and Y. Wang, 2001: The Dynamics of Boundary Layer Jets within the Tropical Cyclone Core. Part II: Nonlinear Enhancement. J. Atmos. Sci., 58, 2485-2501.
- Knapp, K.R., et al., 2010: The International Best Track Archive for Climate Stewardship (IBTrACS). Bull. Amer. Meteorol. Soc., 91, 363 - 376.
- Hall, T.M., and S. Jewson, 2007: Statistical modelling of North Atlantic tropical cyclone tracks. Tellus A: Dynamic Meteorology and Oceanography. 59, 486-498.
- Bloemendaal, N., et al., 2020: Generation of a global synthetic tropical cyclone hazard dataset using STORM. Nature: Scientific Data, 7, 40.
- Knutson, T., et al., 2020: Tropical Cyclones and Climate Change Assessment: Part II: Projected Response to Anthropogenic Warming. Bull. Amer. Meteorol. Soc., 101, E303-322.
- Murakami, H., et al., 2020: Detected climatic change in global distribution of tropical cyclones. Proc. Nat. Acad. Sciences, 117, 10706 - 10714.
- Knutson, T., et al., 2019: Tropical Cyclones and Climate Change Assessment: Part I: Detection and Attribution. Bull. Amer. Meteorol. Soc., 100, 1987-2007.
- Pérez-Alarcón, A., J.C. Fernández-Alvarez and P. Coll-Hidalgo, 2023: Global Increase of the Intensity of Tropical Cyclones under Global Warming Based on their Maximum Potential Intensity and CMIP6 Models. Environmental Processes, 10, doi:10.1007/s40710-023-00649-4.
- Chung, M.V., G. Vecchi, and J. Sun, 31 March 2021: Climate change is probably increasing the intensity of tropical cyclones. NOAA Climate.Gov, accessed June 2026.
- Garner, A.J., 2023: Observed increases in North Atlantic tropical cyclone peak intensification rates. Nature Scientific Reports, 13, 16299. doi:10.1007/s41598-023-42669-y.
- Lee, C.-Y., et al., 2015: Probabilistic multiple linear regression modeling for tropical cyclone intensity. Mon. Weather Rev., 143, 933-954. doi:10.1175/MWR-D-14-00171.1.
- Lee, C.-Y., et al., 2016: Rapid intensification and the bimodal distribution of tropical cyclone intensity. Nature Communications, 7, 10625. doi:10.1007/ncomms10625.
- Lin, N., et al., 2017: A statistical investigation of the dependence of tropical cyclone intensity change on the surrounding environment. Mon. Weather Rev., 145, 2813-2831.
- Hersbach, H., et al., 2020: The ERA5 global reanalysis. Quart. J. Roy. Meteorol. Soc., 146, 1999 - 2049. Doi: 10.1002/qj.3803.
- DeMaria, M., et al., 2005: Further improvements to the Statistical Hurricane Intensity Prediction Scheme (SHIPS). Weather and Forecasting, 20, 531-543. doi:10.1175/WAF862.1.
- Wood, A.W., et al., 2004: Hydrologic implications of dynamical and statistical approaches to downscaling climate model outputs. Climatic Change, 62, 189-216. doi:10.1023/B:CLIM.0000013685.99609.9e.
- World Meteorological Society: “Surface Wind Speed and Direction”. Accessed June 2026.
- Durst, C.S., 1960: The statistical variation of wind with distance. Quart. J. Royal Meteorol. Soc., 86, 543-549. doi:10.1002/qj.49708637012.
- American Society of Civil Engineers (ASCE), 2017?: Minimum design loads for buildings and other structures, SEI/ASCE 7-05. Reston, VA, ASCE. doi:10.1061/9780784408094.
- Masdua, M., et al., 2019: Daily adjustment for wind-induced precipitation undercatch of daily gridded precipitation in Japan. Earth and Space Science, 6, 1469-1479. doi:10.1029/2019ea000659.
- Menne, Matthew J., Imke Durre, Bryant Korzeniewski, Shelley McNeill, Kristy Thomas, Xungang Yin, Steven Anthony, Ron Ray, Russell S. Vose, Byron E.Gleason, and Tamara G. Houston (2012): Global Historical Climatology Network - Daily (GHCN-Daily), Version 3. NOAA National Climatic Data Center. doi:10.7289/V5D21VHZ.
- Météo-France. Wind speed observations. Accessed at: https://meteo.data.gouv.fr/datasets?category=observations
- Japan Meteorological Agency. Automated Meteorological Data Acquisition System, wind speed observations. Accessed at: https://www.jma.go.jp/jma/en/Activities/amedas/amedas.html
- Smith, A., N. Lott, and R. Vose, 2011: The integrated surface database: Recent developments and partnerships. Bull. Amer. Meteorol. Soc., 92, 704-708. doi:10.1175/2011BAMS3015.1.
- Kimberlain, T.B., E.S. Blake, and J.P. Cangialosi, 2016: Hurricane Patricia. National Hurricane Center Tropical Cyclone Report, 2015. Accessed June 2026.
- McInnes, K.L., T.A. Erwin, and J.M. Bathols, 2011: Global climate model projected changes in 10 m wind speed and direction due to anthropogenic climate change. Atmos. Sci. Lett., 12, 325 - 333. doi:10.1002/asl.341.
- Kumar, D., V. Mishra, and A.R. Ganguly, 2014: Evaluating wind extremes in CMIP5 climate models. Climate Dynamics, 45, 441 - 453. doi:10.1007/s00382-014-2306-2.
- Jeong, D.I., and L. Shushama, 2019: Projected changes to mean and extreme surface wind speeds for North America based on regional climate model simulations. Atmosphere, 10. doi:10.3390/atmos10090497.
- Langford, K., 20 December 2025: Here are the highest speeds recorded during Colorado’s severe windstorm. Denver Post. Accessed June 2026.
- National Weather Service, Pueblo, CO: Monarch Pass Wind Gust of 148 mph considered accurate! National Oceanic and Atmospheric Administration. Accessed June 2026.
- National Hurricane Center, National Oceanic and Atmospheric Administration. Tropical Cyclone Climatology, 2017. Accessed: 2024-8-17.
- National Weather Service, Miami, FL: Saffir-Simpson Hurricane Scale. National Oceanic and Atmospheric Administration. Accessed June 2026.
- Avila, L.A., et al., 2020: Hurricane Dorian. National Hurricane Center Tropical Cyclone Report, 2019. Accessed June 2026.
- Iowa State University Iowa Environmental Mesonet, 2026: Automated Surface Observing System (ASOS). Accessed 10 June 2026.
- Woodruff, J.D., et al., 2015: Depositional evidence for the Kamikaze typhoons and links to changes in typhoon climatology. Geology, 43, 91 - 94. doi:10.1130/G36209.1.
- Lies, E., and S. Sugiyama, 3 August 2023: Typhoon Kanun kills two in Japan's Okinawa, injures at least 62. Reuters. Accessed June 2026.
- Inoue, Y., and J. Speed, 29 August 2024: Heavy rain batters Japan after Typhoon Shanshan makes landfall in Kyushu. Japan Times. Accessed June 2026.
- Moemken, J., et al., 2024: Insurance loss model vs. meteorological loss index – how comparable are their loss estimates for European windstorms? Natural Hazards and Earth Systems Science, 24, doi:10.5194/nhess-24-3445-2024.
- Radio France Internationale, 16 December 2011: Power cuts, oil spills and cancelled trains as Storm Joachim lashes France. RFI.com. Accessed June 2026.
