.webp)

Building a model is one thing. Knowing whether it can be trusted — especially for locations, time periods, and conditions it has never encountered before — is another. After Jupiter’s wildfire model has passed verification, it undergoes a validation process. This means ensuring the model is accurately predicting high fire risk in areas that have actually seen high fire risk in the real world.
Wildfire: A Growing Economic and Health Risk
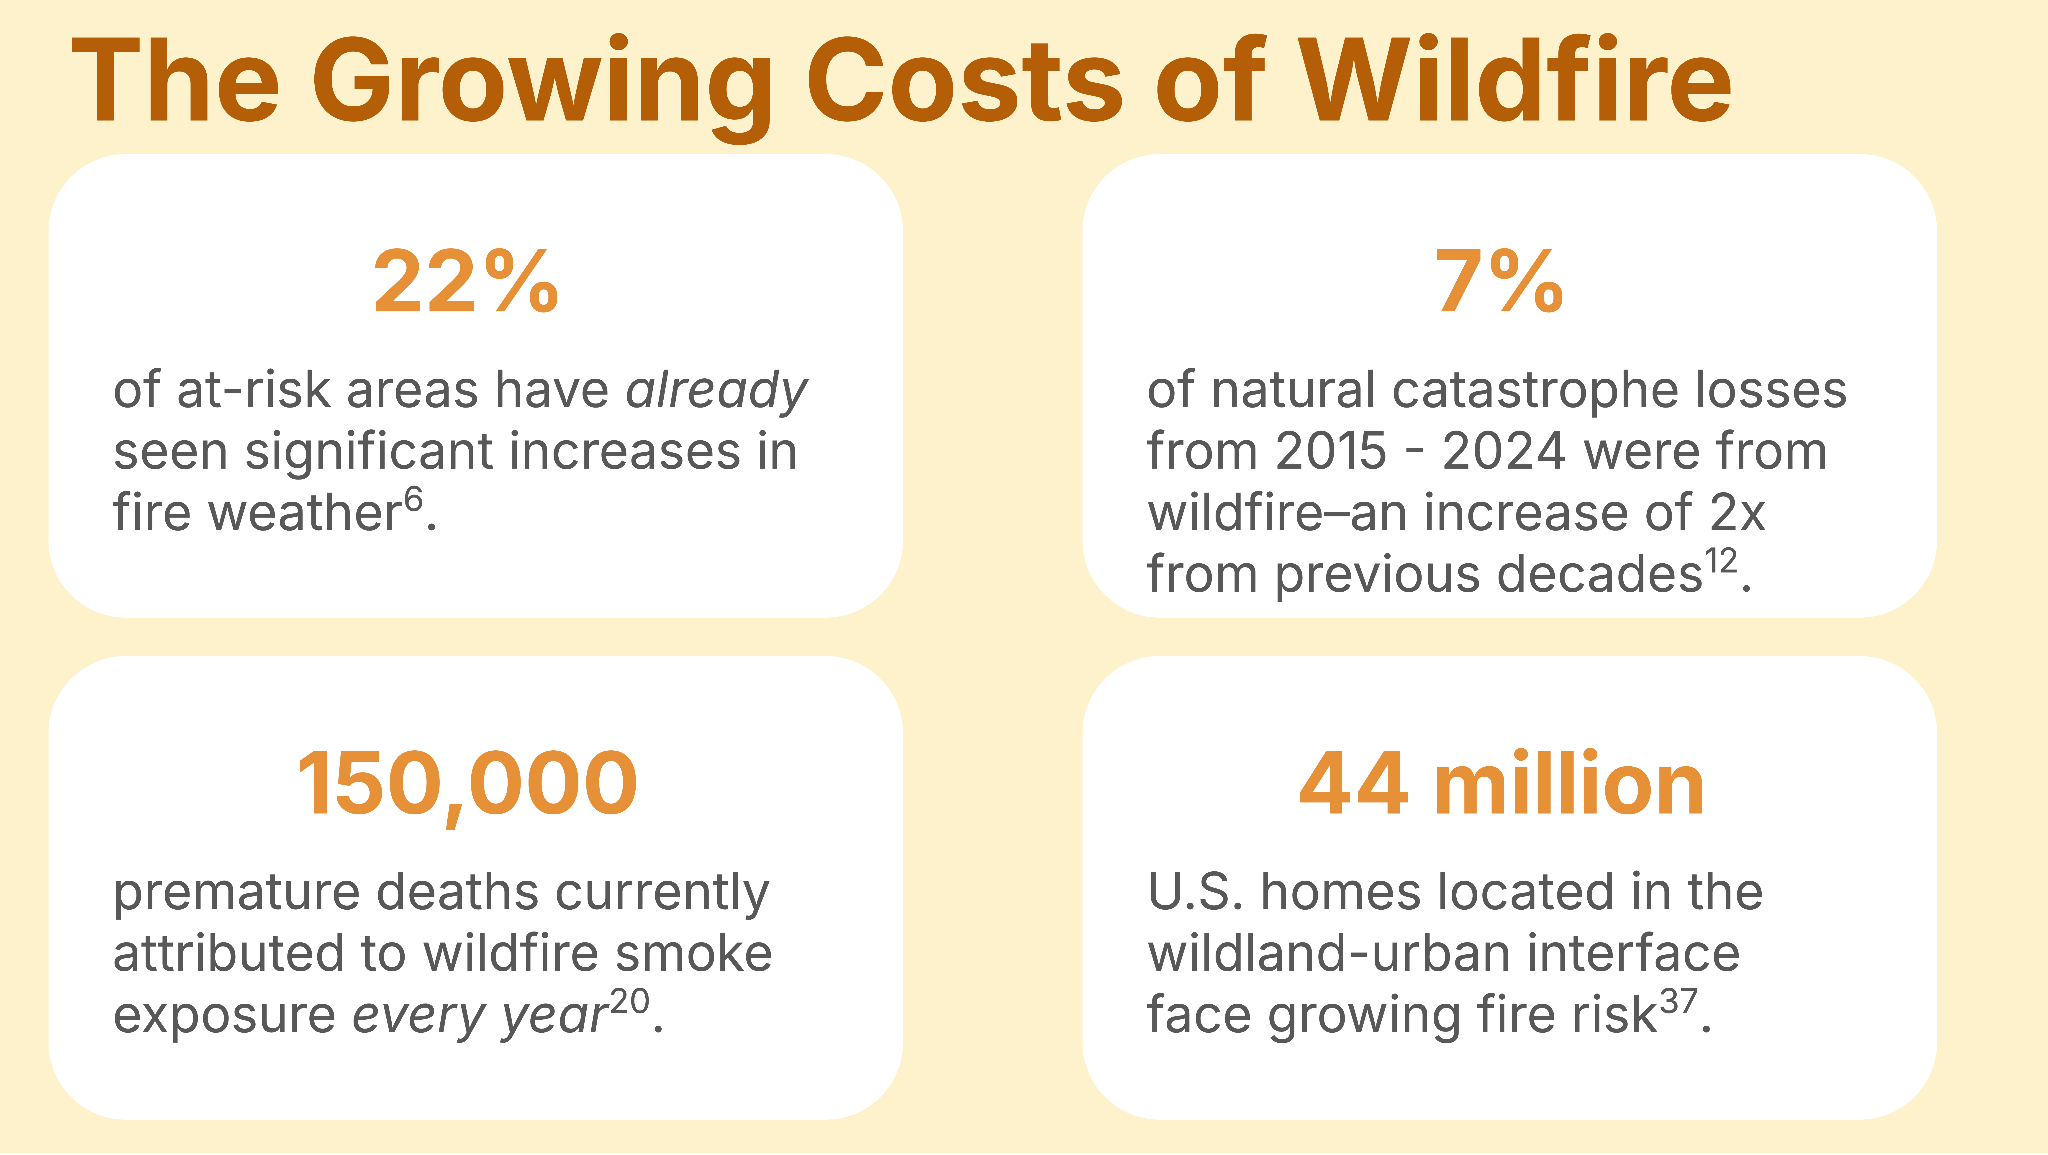
Wildfire is one of the fastest growing climate risks. The hot, dry, and windy conditions that dry out trees and allow fires to start, grow, and spread have become increasingly common1. Fires have become larger, more severe, and more dangerous2, and the most destructive wildfires are growing twice as fast as they once did3. Fire season has gotten longer – nearly doubling in length in some areas1,4. As temperatures continue to rise, wildfire risk is likely to climb, though potential increases in humidity could modulate wildfire risk in select areas5. Over 20% of fire-prone areas have already seen a measurable increase in extreme fire weather conditions, with considerable increases expected over the next 25 years6. Already high-risk areas in Australia7, France8, and the western U.S.9 could see fire risk multiply by a factor of two to four. Fire season could last two weeks longer in northern and central Europe by 204010, while the boreal forests of Russia, Canada, Scandinavia, and Alaska could see fire season lengthen by three weeks or more11.
The Cost of Wildfire
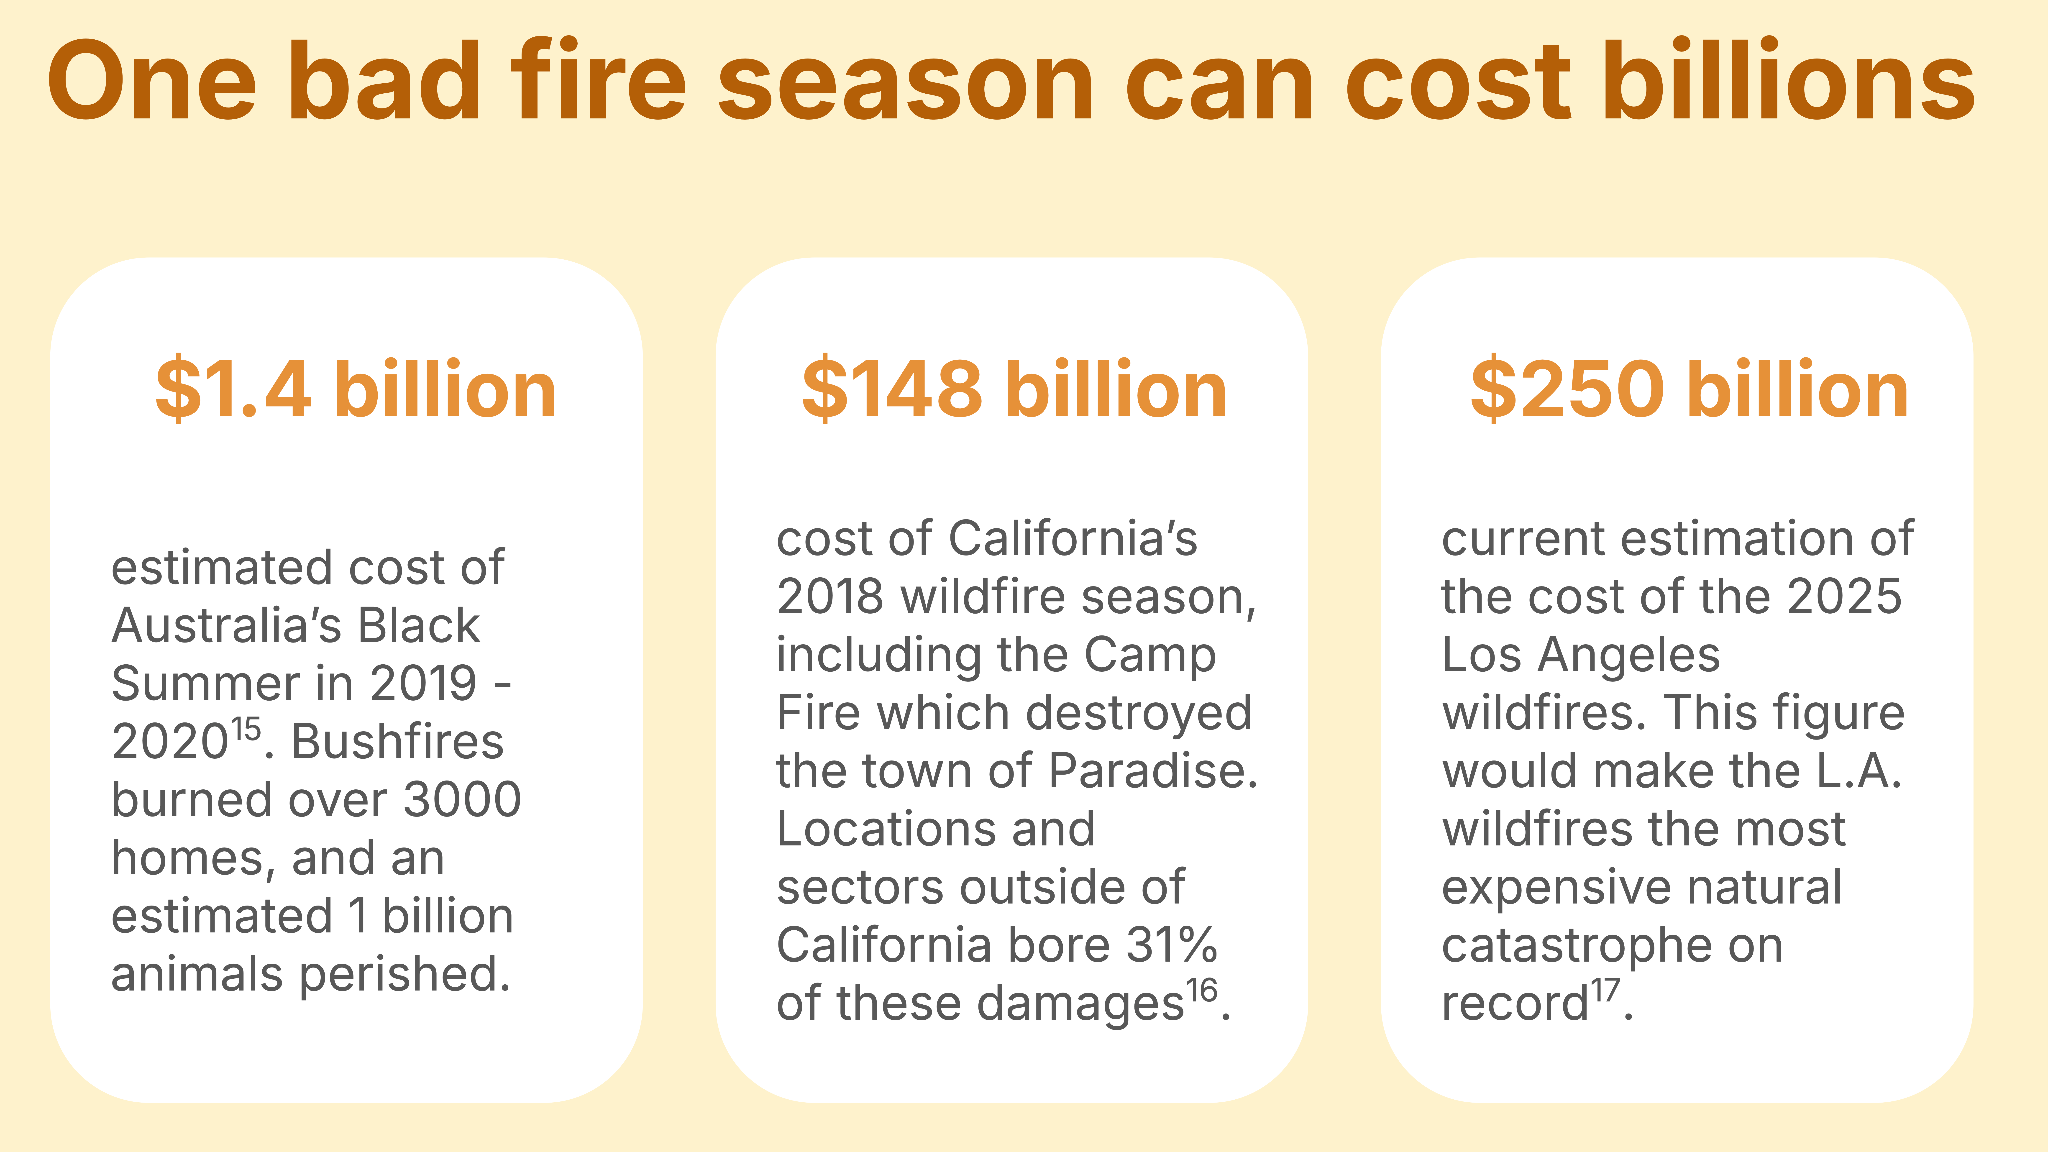
The human and economic costs of wildfire have been increasing rapidly, especially in the last decade. Between 1985 and 2014, losses from wildfires only made up only 1 - 3% of total losses. The insurer Swiss Re estimates that between 2015 and 2024, wildfires were responsible for an estimated $78 billion in insured losses, comprising 7% of total natural catastrophe losses for this period12.
- In Europe, wildfires cost an estimated €2.5 billion per year, and are directly responsible for 741 deaths since 198113.
- In the U.S., wildfires cost an estimated $4.7 billion per year and have directly killed 568 people since 198014.
- A single disastrous wildfire season can bring billions of dollars in damages. Australia’s catastrophic 2019 - 2020 wildfire season cost an estimated $1.4 billion15, and California’s 2018 wildfires cost over $100 billion16. The Los Angeles wildfires of January 2025 cost an estimated $250 billion, setting a new record for the most expensive natural hazard on record17.
Both wildfires and the smoke they produce have major human health impacts. People who are exposed to wildfire smoke have increased rates of respiratory or cardiovascular health issues18, and major wildfire events can cost the healthcare system billions19.
- Currently, wildfire smoke is responsible for an estimated 150,000 deaths per year20, and this number could double over the 21st century21.
- A recent study estimates that in the U.S., wildfire smoke could be responsible for an additional 70,000 deaths per year by 205022 – nearly triple the current estimates of deaths attributed to wildfire smoke exposure23.
- And since the smoke from wildfires can travel thousands of miles, it’s not just nearby communities who are impacted by wildfire smoke. In much of North America, for example, most areas are more impacted by smoke from distant fires than smoke from nearby fires24.
Wildfires also contaminate soil and drinking water, especially when they destroy urban environments. After urban fires like the 2025 Los Angeles wildfires, burning homes and utility lines can deposit lead, mercury, copper, and other carcinogenic substances in the soil25-27. Rainfall and erosion can then carry those contaminants to drinking water, further exacerbating exposure to pollutants28,29. High levels of these contaminants also lead to increased remediation costs in fire-affected locations.
The risks associated with wildfire are growing rapidly, especially in North America, Europe, and Australia. As wildfire risk continues to rise, so do concerns about its economic and health impacts.
How Jupiter Models Wildfire Risk
Jupiter’s wildfire model provides a quantitative estimate of the annual average probability of a catastrophic wildfire – a wildfire with the potential to cause significant structural loss. The model uses weather reanalysis products, fire models, satellite imagery, and land use information to make wildfire probability estimates with machine learning methods.
Catastrophic wildfires are inherently rare events. Even fire-prone environments require either natural ignitions like lightning, or human ignition like campfires or powerlines to start fires. Catastrophic wildfires require that three conditions align at a specific location: weather and fuel conditions conducive to fire growth, an ignition source, and the sustained conditions necessary for a small spot fire to grow into a multi-billion dollar catastrophe. Because all three must occur together, the probability of a catastrophic wildfire at any given location is inherently very small — making an average annual probability of even 1% a meaningful indicator of high fire risk.
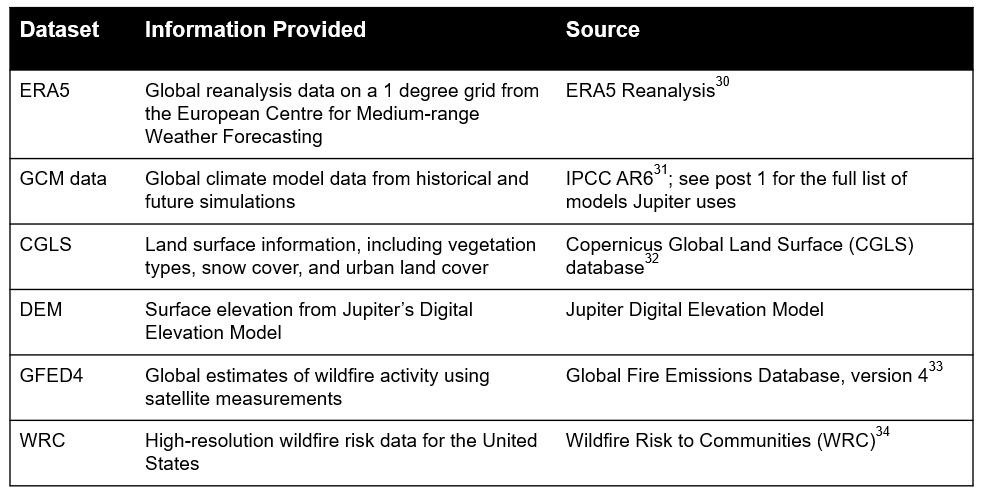
Jupiter’s wildfire model uses several data sources, described in Table 1. These datasets provide historical and future weather and climate variables (e.g., temperature, precipitation, relative humidity); land surface information (e.g., vegetation, snow cover, urban land cover); elevation data; and satellite-derived global estimates of wildfire activity.
Urban land cover is particularly important for fire modeling. While densely urban, highly built environments such as downtown San Francisco or Sydney are not likely to burn, the surrounding areas are a different story. The wildland-urban interface, or WUI, is the environment where the human-built environment meets the natural landscape. This high-risk environment covers only a small amount of the Earth’s surface – less than 5% by most estimates, but is home to an estimated 3.5 billion people35. In North America and Europe, the WUI has been expanding rapidly as housing expands further from city centers. The European WUI, already as much as 15% of the continent, has grown by 2% since 200136, while the WUI in the U.S. has increased nearly 50% since 1990, and contains an estimated 44 million homes37.
Jupiter’s wildfire model uses land cover data from sources like WRC and CGLS to specifically model urban environments, distinguishing between highly urban environments and the high-risk WUI environments that are often the site of catastrophic wildfires. Jupiter wildfire risk experts routinely inspect model outputs, ensuring that annual wildfire probabilities are reasonable across a variety of environments. They validate, for example, that burn probabilities directly over large bodies of water are low, while burn probabilities in the WUI are higher.
Verifying the Model: Internal Consistency Checks
Verification refers to quality control steps within the peril production software pipeline. Verification is performed on all Jupiter peril models, ensuring their outputs are physically consistent and realistic. Verification steps are specific to each peril, and include software engineering controls, expert inspection of intermediate outputs, and checking against external data when applicable. Verification is done for each peril, scenario, and epoch (see Figure 1 for epoch definitions).

Jupiter uses a variety of technical and cross-level checks for product assessment. Throughout the verification process, Jupiter’s wildfire risk experts inspect the results and ensure that they are reasonable, accurate, and reflect the current state of wildfire science. For the wildfire model, the rigor we use to create a Jupiter Quality Score (JQS) includes:
- Verifying raw metric values and ensuring that these values make sense physically. For the wildfire model, annual wildfire probabilities should always be between 0 and 1, and values above 0.5 are flagged for further review.
- Calculating an uncertainty range. For the wildfire model, an uncertainty bound that is less than 0 or greater than 0.1 is flagged for further review.
- Checking the difference across consecutive years. Later years should generally have greater wildfire risk than earlier years. However, fire risk can be affected by patterns that vary on year-to-year timescales (such as the El Niño-Southern Oscillation31), meaning that small year-to-year decreases are consistent with known climate dynamics. For JQS, the year-to-year difference must be between 0.05 and - 0.05.
- Missing data. Wildfire metrics are checked to ensure that there is no unexpected missing data, and that metrics exist consistently for all forecast years at all locations.
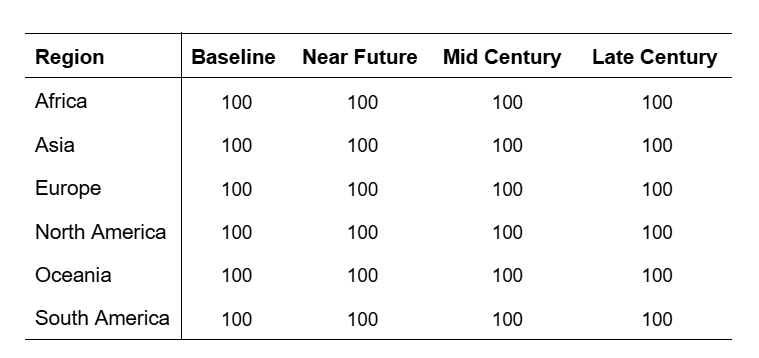
The JQS is created by averaging the wildfire model results across years within an epoch, and locations within a region. A JQS of 50 or more is considered good, and a JQS of 100 is considered great. For the wildfire model, the JQS for all regions in all epochs is 100, indicating that the wildfire metric (average annual wildfire probability) passes the above JQS tests at every location in every region (Table 2). It should not be interpreted that it is perfect everywhere. Rather, it means that the wildfire model passed the subjective quality control tests specified above for each scenario/year combination at each location.
Validating the Model Against the Real World
Building a model is one thing. Knowing whether it can be trusted — especially for locations, time periods, and conditions it has never encountered before — is another. After Jupiter’s wildfire model has passed verification, it undergoes a validation process. This means ensuring the model is accurately predicting high fire risk in areas that have actually seen high fire risk in the real world.
To achieve this, we compare the model output to two external datasets containing regional wildfire data from 2017 to 2025 – years that were not used to train the model. For the U.S., we use the United States Forest Service’s Monitoring Trends in Burn Severity (MTBS)38 dataset, and for Europe and the Mediterranean, we use the European Forest Fire Information System (EFFIS)39. Neither dataset was used to train the model, so this provides an independent, out-of-sample comparison. We also compare the model to the global wildfire estimates from GFED433.
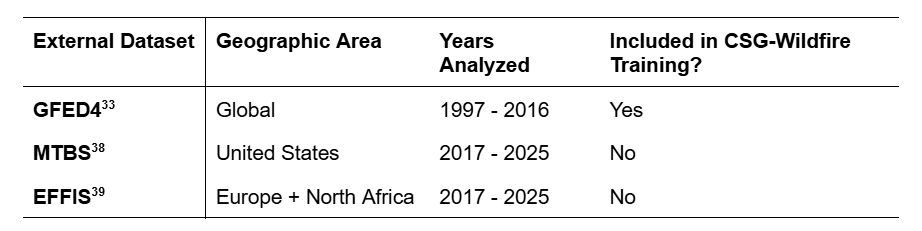
Why Out-of-Sample Testing Matters
One of the most consequential pitfalls in wildfire exposure assessment is equating a calm historical record with low risk. A location that has never experienced a catastrophic wildfire is not necessarily at low risk for one – or more. Acting on that misreading can mean overvalued assets, underpriced risk premiums, breached risk thresholds or inadequate adaptation investment, because risks that exist outside of the sample won’t surface in the data – and that can mean no warning at all before an uninsurable exposure destabilizes an entire portfolio. The risks that were always there but never surfaced in the historical record are the ones most likely to catch portfolios off guard.
When used alone, historical loss records are often too short, too geographically uneven, or too skewed by recent high-loss events to reliably predict where the next catastrophic fire will occur, because they have been calibrated to a version of the past that no longer reflects current or future conditions. But their inherent blind spots can be addressed by adding more rigor to the validation process. We do this by adding generalizability and ensuring the model’s fitness for the data record.
First, we note that a skillful model is generalizable, meaning it should perform well on data it has never seen before. Out-of-sample testing is how we achieve that. It forces us to ask two questions about our model:
Can the model perform when conditions change or data sources shift?
- A generalizable model should still be able to make useful predictions for locations where observational records are shorter, spatially sparse, or of lower quality, such as the global south — where growing economic development and expanding wildland-urban interfaces are increasing exposure precisely in the places history has least prepared us for.
- It should also be able to make useful predictions even if part of the data used to train the model becomes unavailable — for example, if a source of satellite data is no longer available, or if a weather station is damaged.
- And it should still perform even if our future climate is not exactly the same as our past climate.
Did the model learn from a training window that was representative of real-world risk?
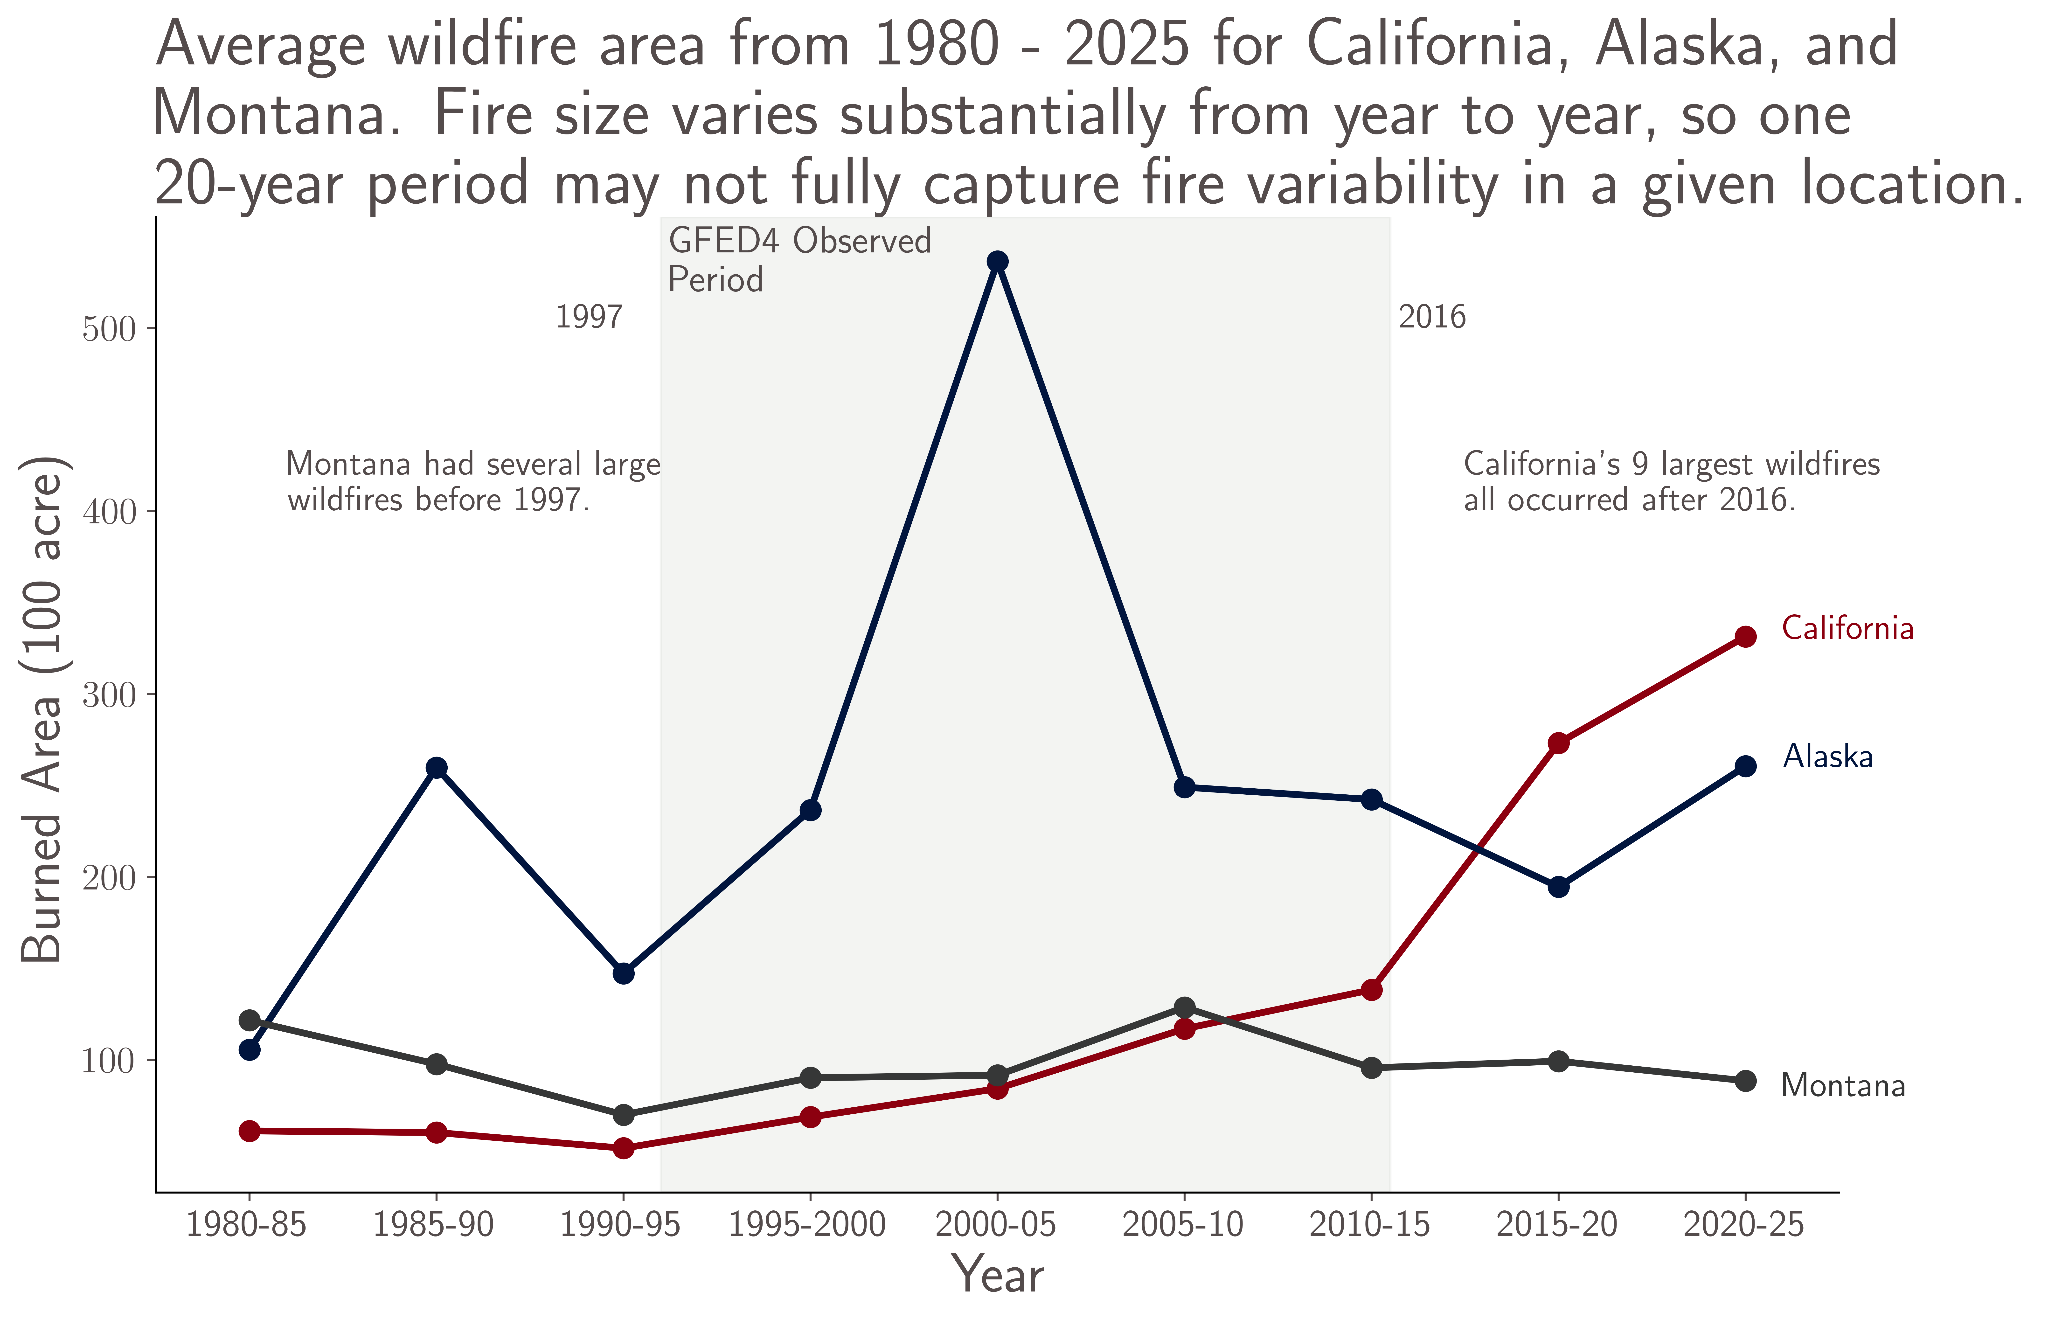
- GFED4 encompasses 20 years of global wildfire data. While 20 years is substantial, it is not necessarily long enough to capture the full range of fire risk. In Figure 2, we see that fires vary substantially across the years in California, Alaska, and Montana. This variability can be due to meteorological and climatological factors, vegetation changes, or land management practices.
GFED4's records end in 2016, but most of California's largest and most destructive fires occurred after 2016 — meaning a model that only learned from that window would have been trained on a systematically quieter California than the one that actually exists.
- Conversely, GFED4 includes some of Alaska's largest fire years in the early 2000s, but does not include several of the less active fire periods in the early 1990s — a reminder that a short record can overrepresent extremes just as easily as it can underrepresent them.
By evaluating our model against wildfires that occurred from 2017 to 2025, we further ensure that it is not overfitting to the 20-year GFED4 observed time period. For risk assessment, that means a model that has been tested against the world as it actually unfolded. Out-of-sample validation surfaces risk that a shorter or under-representative historical record might otherwise miss, bringing it into view so that it can be captured, assessed, and mitigated or adapted for. That leaves portfolios more precisely calibrated and better positioned to withstand what comes next.
U.S. Validation: Fire-prone Areas Show up to 250% Higher Risk
How does Jupiter’s wildfire model perform on U.S. wildfires from 2017 to 2025?
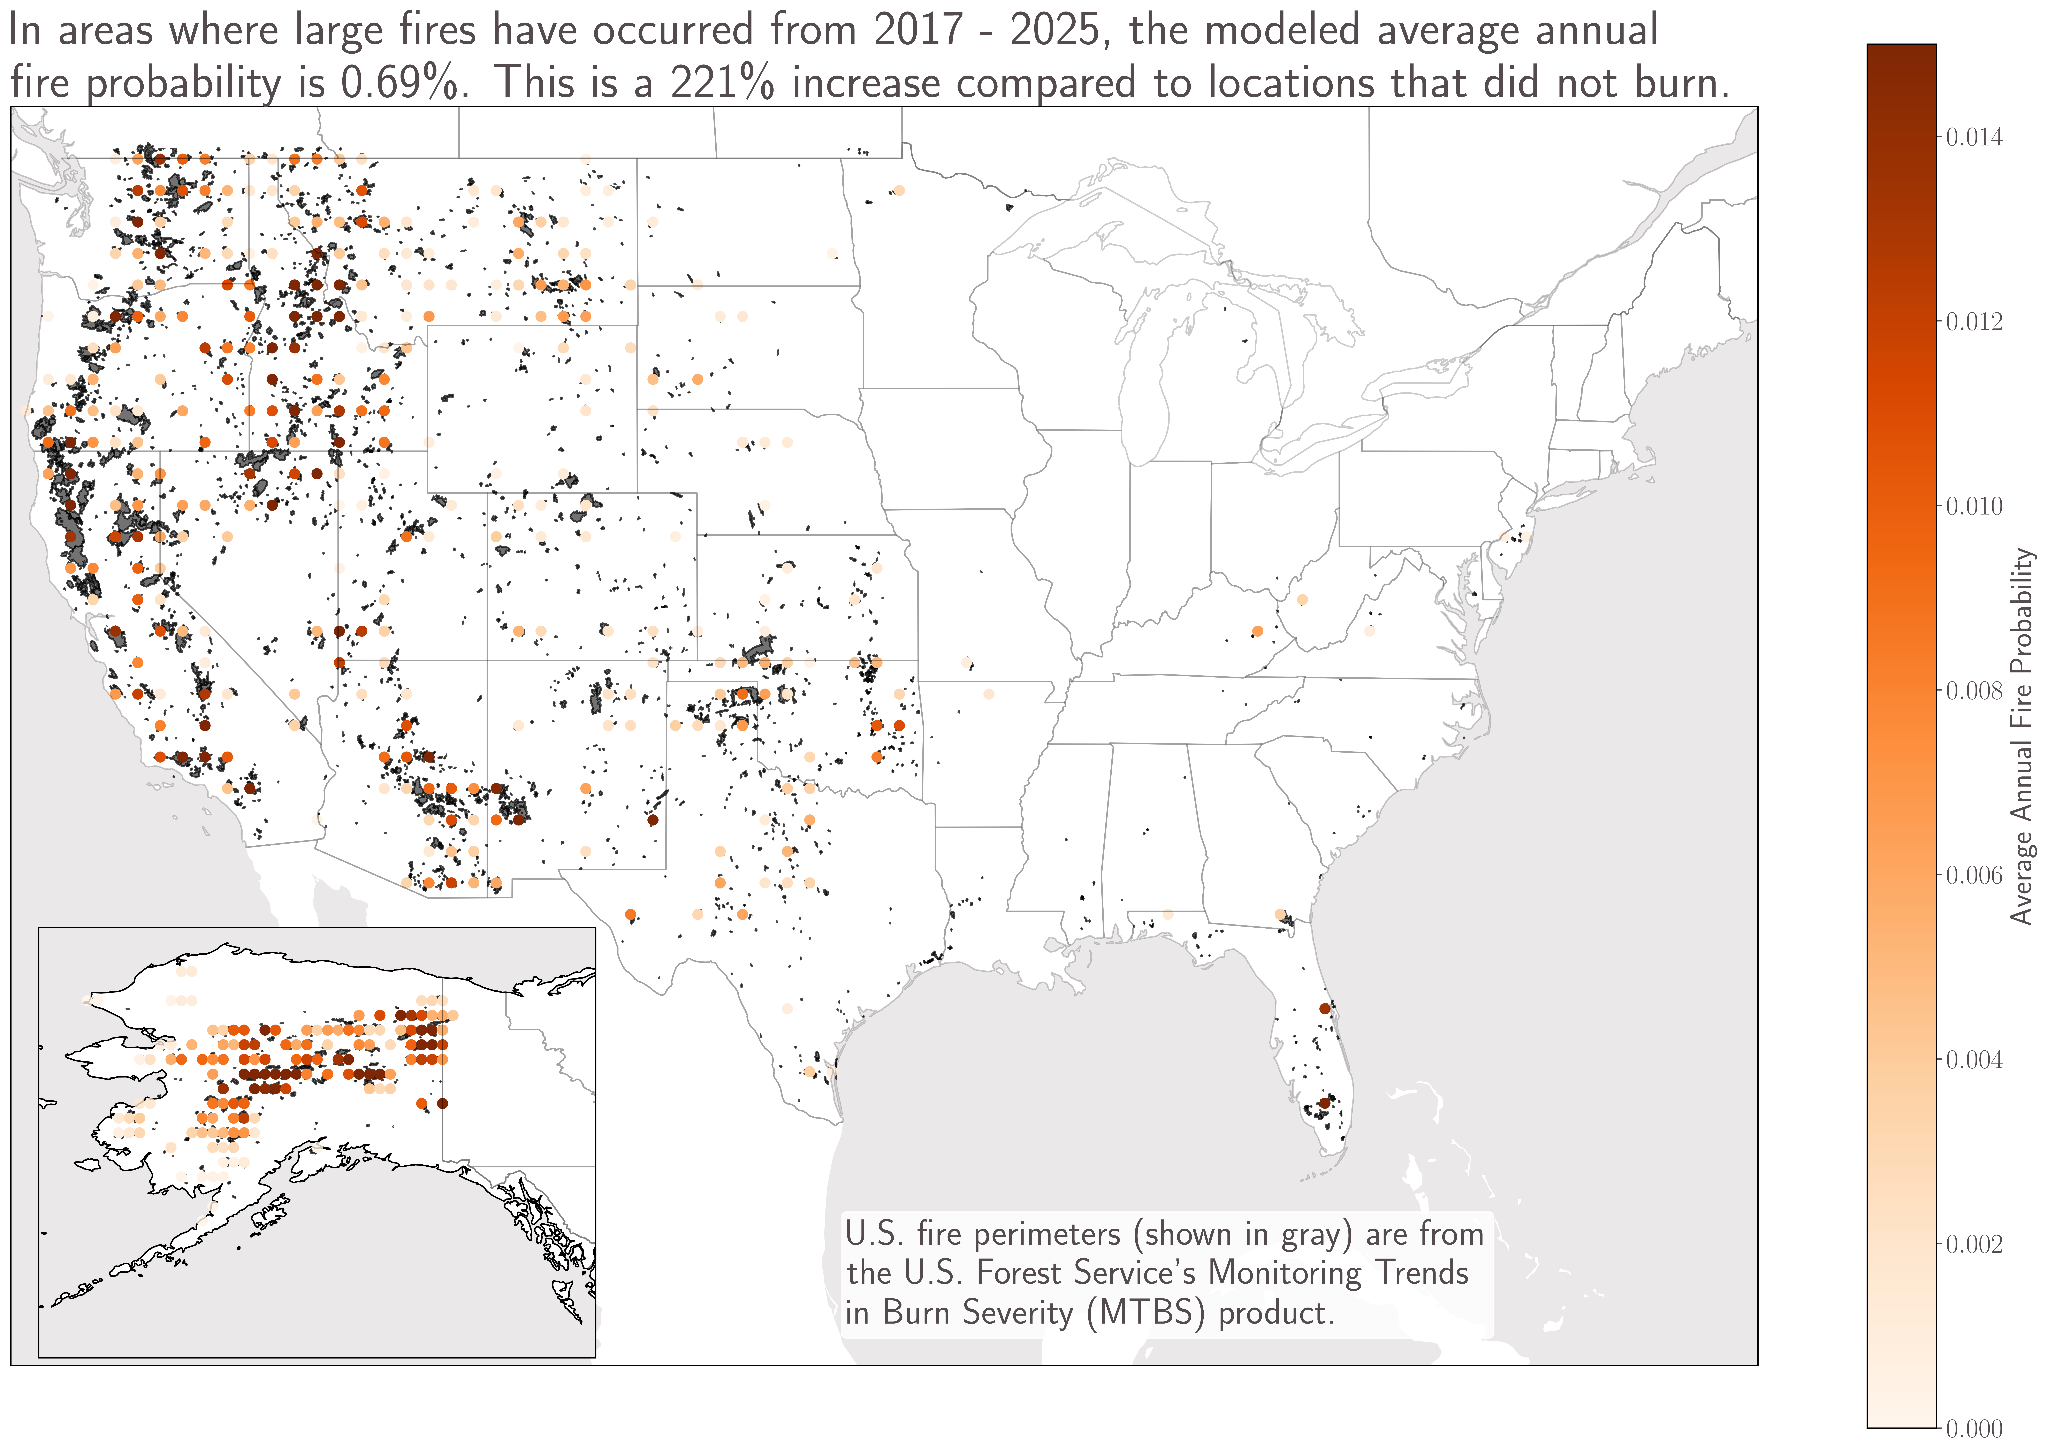
We identify large wildfires with the USFS "Monitoring Trends in Burn Severity" fire perimeter dataset. This program and dataset maps the burn severity and extent of large fires across the U.S., including Alaska, Hawaii, and Puerto Rico. We include only wildfires that reach a burned area of at least 1000 acres. Our wildfire model points are considered co-located with a fire if they are within 20 km (12.4 miles) of the fire perimeter.
Validation confirms that our wildfire model’s probabilities show higher risk where recent fires have occurred. Figure 3 shows that our model’s average annual fire probability for areas where large fires have occurred is nearly 250% higher than locations that did not burn from 2017 to 2025. In locations where recent large fires have occurred, the Jupiter wildfire model’s annual average probability is 0.69%, meaning that a catastrophic wildfire has an 0.69% chance of happening in a given year (or, that a catastrophic wildfire is approximately a 1-in -150-year event on average). Over 20% of large-fire locations have an average annual wildfire probability of at least 0.01, meaning that there is at least a 1% chance of catastrophic wildfire in that location in a given year.
European Validation: Fire-prone Areas Show 149% Higher Risk
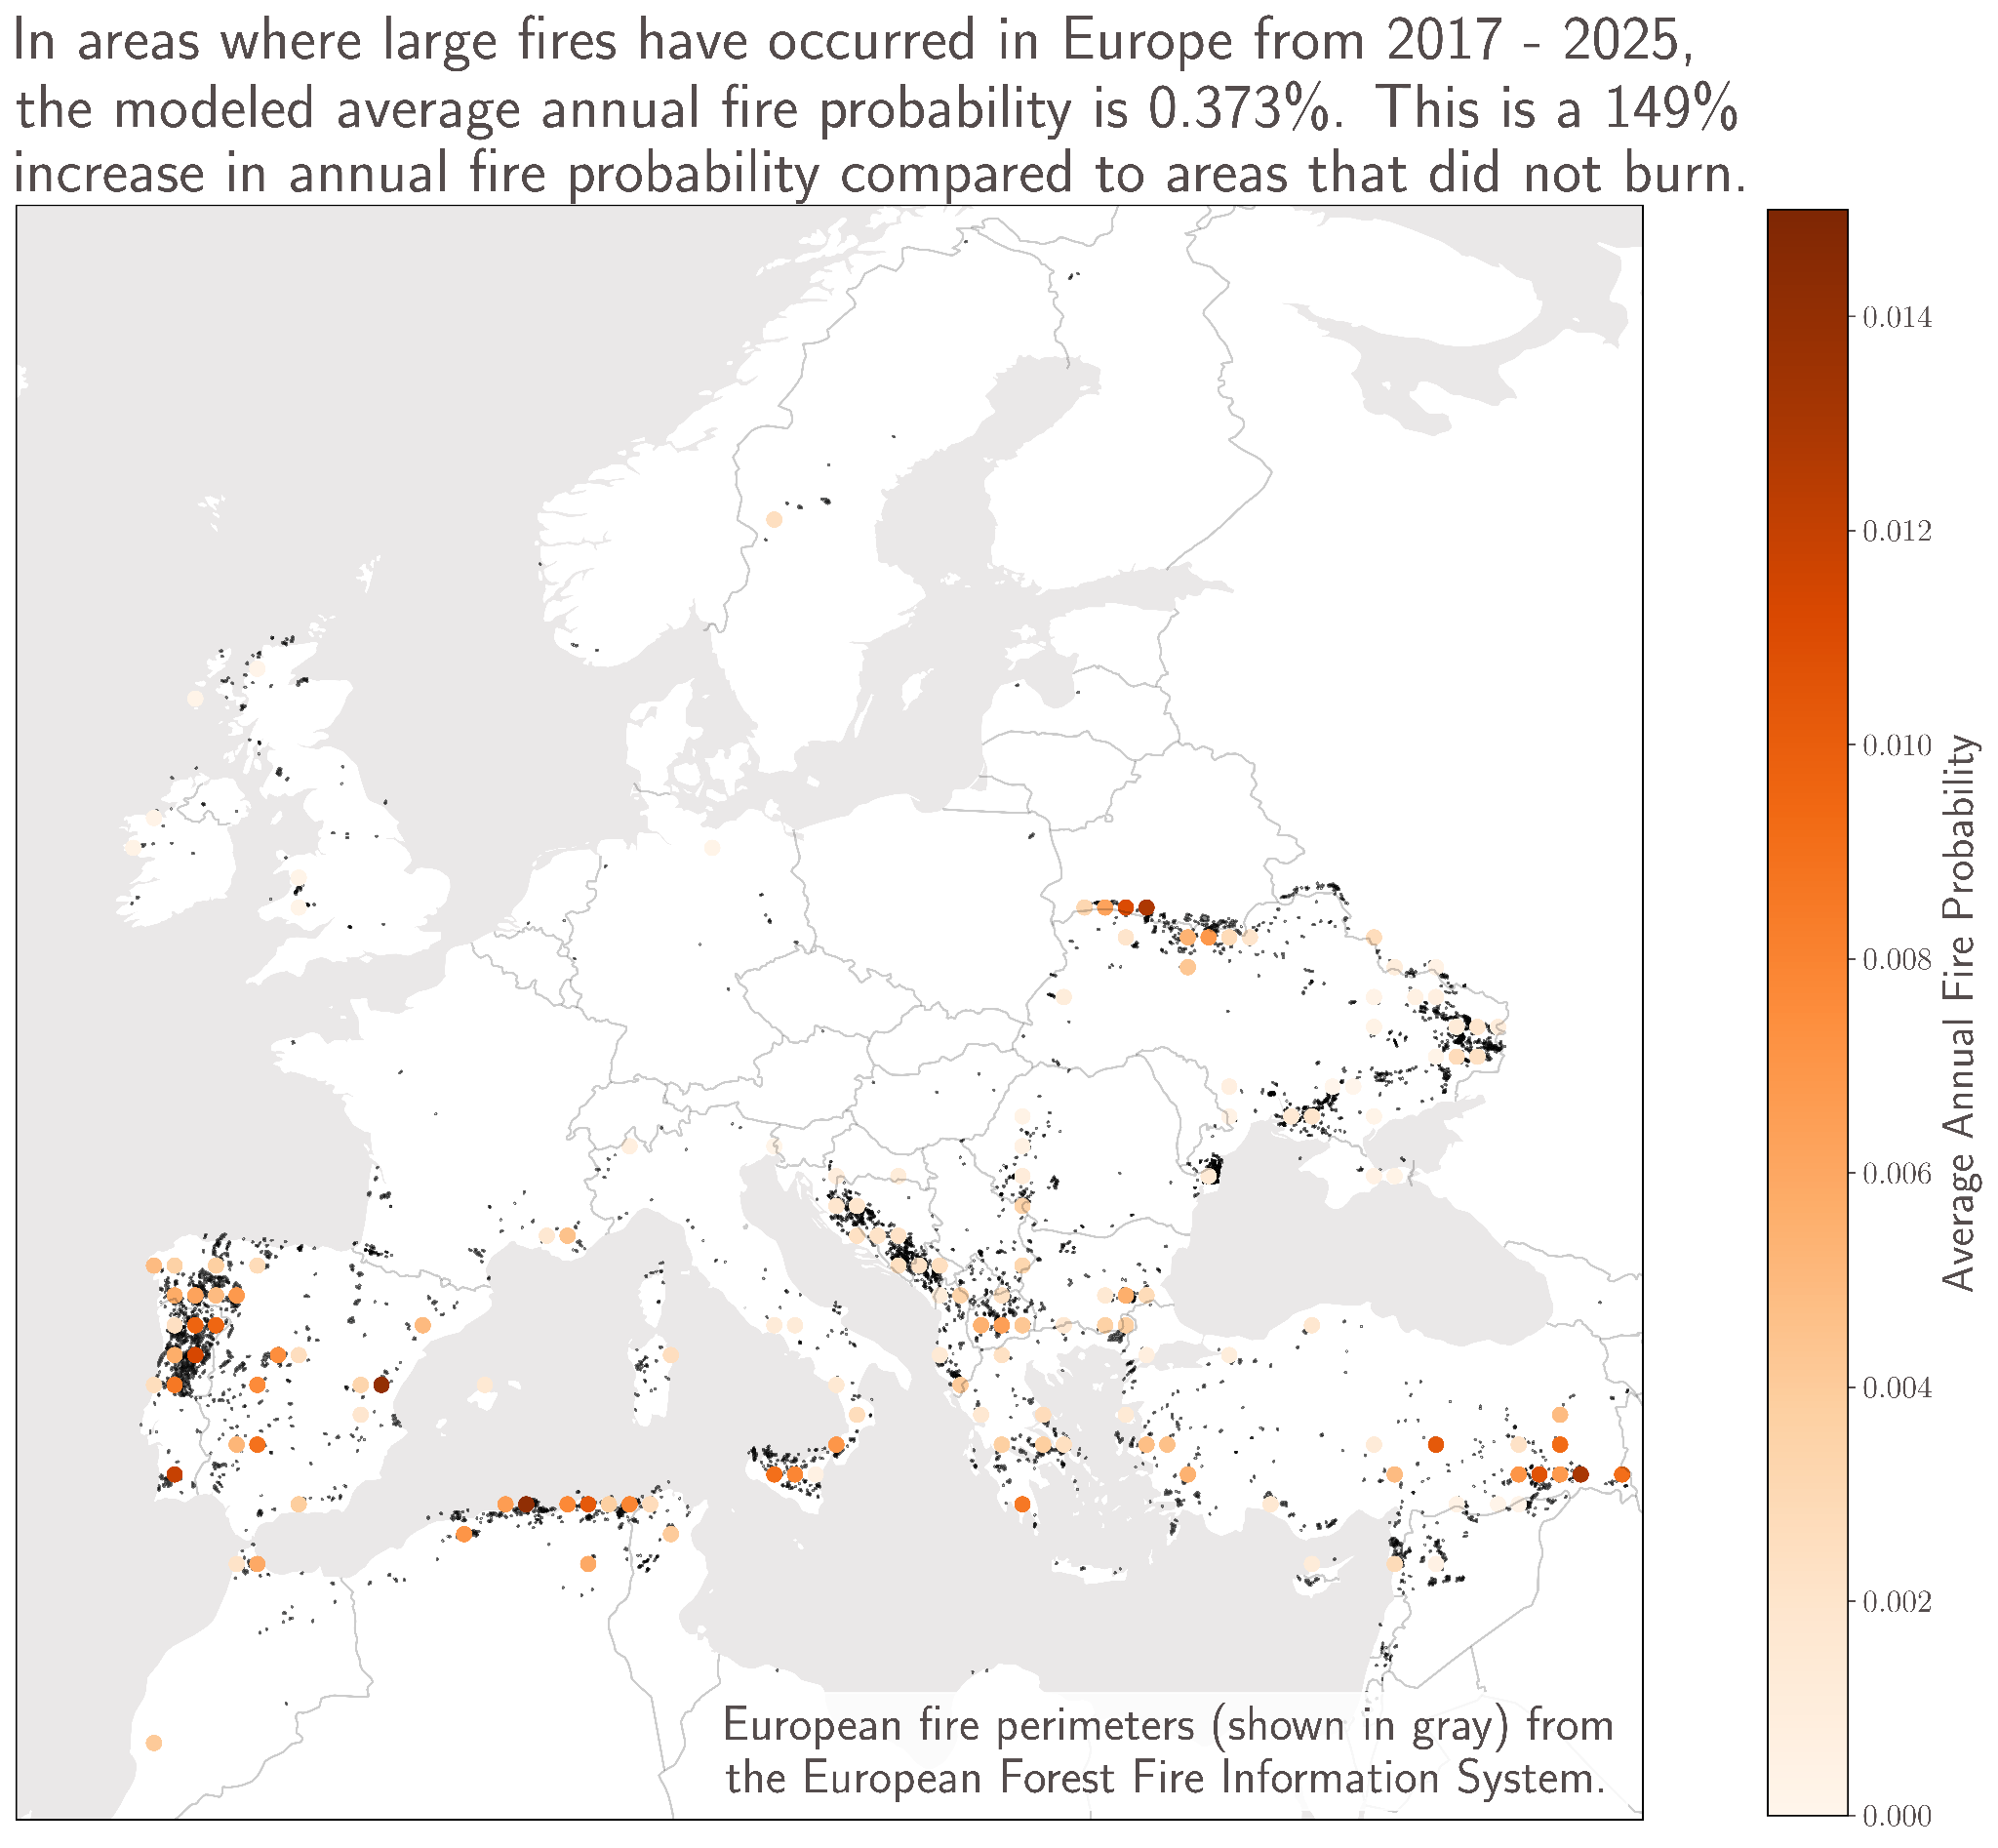
We perform a similar analysis on European and Mediterranean wildfires. For this analysis, we use the European Forest Fire Information System (EFFIS), provided by Copernicus. The EFFIS fire database includes fires in Europe, the eastern Mediterranean, and North Africa. As with the U.S. fires, we include only large fires that reach a burn area of at least 400 hectares (approximately 1000 acres). For the European fires, our wildfire model points are considered co-located with a fire if they are within 10 km (6.2 miles) of the fire perimeter.
Similar to the U.S., we find that the Jupiter wildfire model’s average annual wildfire probability is about 3 times larger for locations with recent fires (Figure 4).
Finally, when we compare the average annual wildfire probability for recent fire locations in the U.S. and Europe to the global average annual wildfire probability, we see that locations that experienced recent fires have an average of 2 to 3.5x higher annual wildfire probability (Figure 5).
So to summarize, Jupiter’s wildfire model skillfully identifies the areas near recent wildfires in the U.S. and Europe as having a wildfire risk 2 to 3.5 times greater than areas not near recent wildfires. Our model successfully generalizes fire risk to time periods and datasets not included in model training.
.png)
Where History Underestimates Risk: Emerging Threats in Boreal Forests
For a more global validation of the Jupiter wildfire model, we compare it to the global GFED4 dataset. As our model was trained on GFED4 data, we note that this is not a fully independent comparison; nevertheless, global wildfire datasets are limited, so we use GFED4 as a comparison. To estimate wildfire probability from GFED4, we calculate the annual probability that a grid cell has experienced at least one wildfire between 1997 - 2016. If any burned area was detected in a grid cell in any month for that year, that grid cell received a value of 1 for that year; these probabilities were computed for each grid cell in each year, and averaged over the 20-year time period.
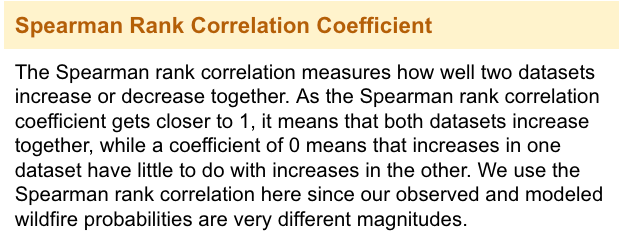
Wildfire probabilities have different orders of magnitude in our model and GFED4. Therefore, a direct numeric comparison is not entirely helpful. We sort the fire probabilities of each dataset (observed and modeled wildfire probabilities) into three bins – the lowest third in “Low”, the middle third in “Medium”, and highest third of the data in “High”. This strategy allows us to qualitatively compare regions of low and high fire risk across datasets without worrying about differences in magnitude.
In Figure 6, it’s clear that the high-risk areas in the observed dataset correspond well with high-risk areas in the modeling. Areas known to have a high wildfire risk such as the Amazon, sub-Saharan Africa, western North America, and Australia, are indicated as having medium or high fire risk in both datasets. Similarly, areas with a low fire risk such as the Sahara desert, the Patagonian ice field, and the Arabian peninsula have low fire risk in both datasets. Globally, the annual wildfire probability in the wildfire model is about 50% higher in areas with high observed fire risk, and only 3% of points that were identified as “high” observed fire probability are classified as “low” fire probability.
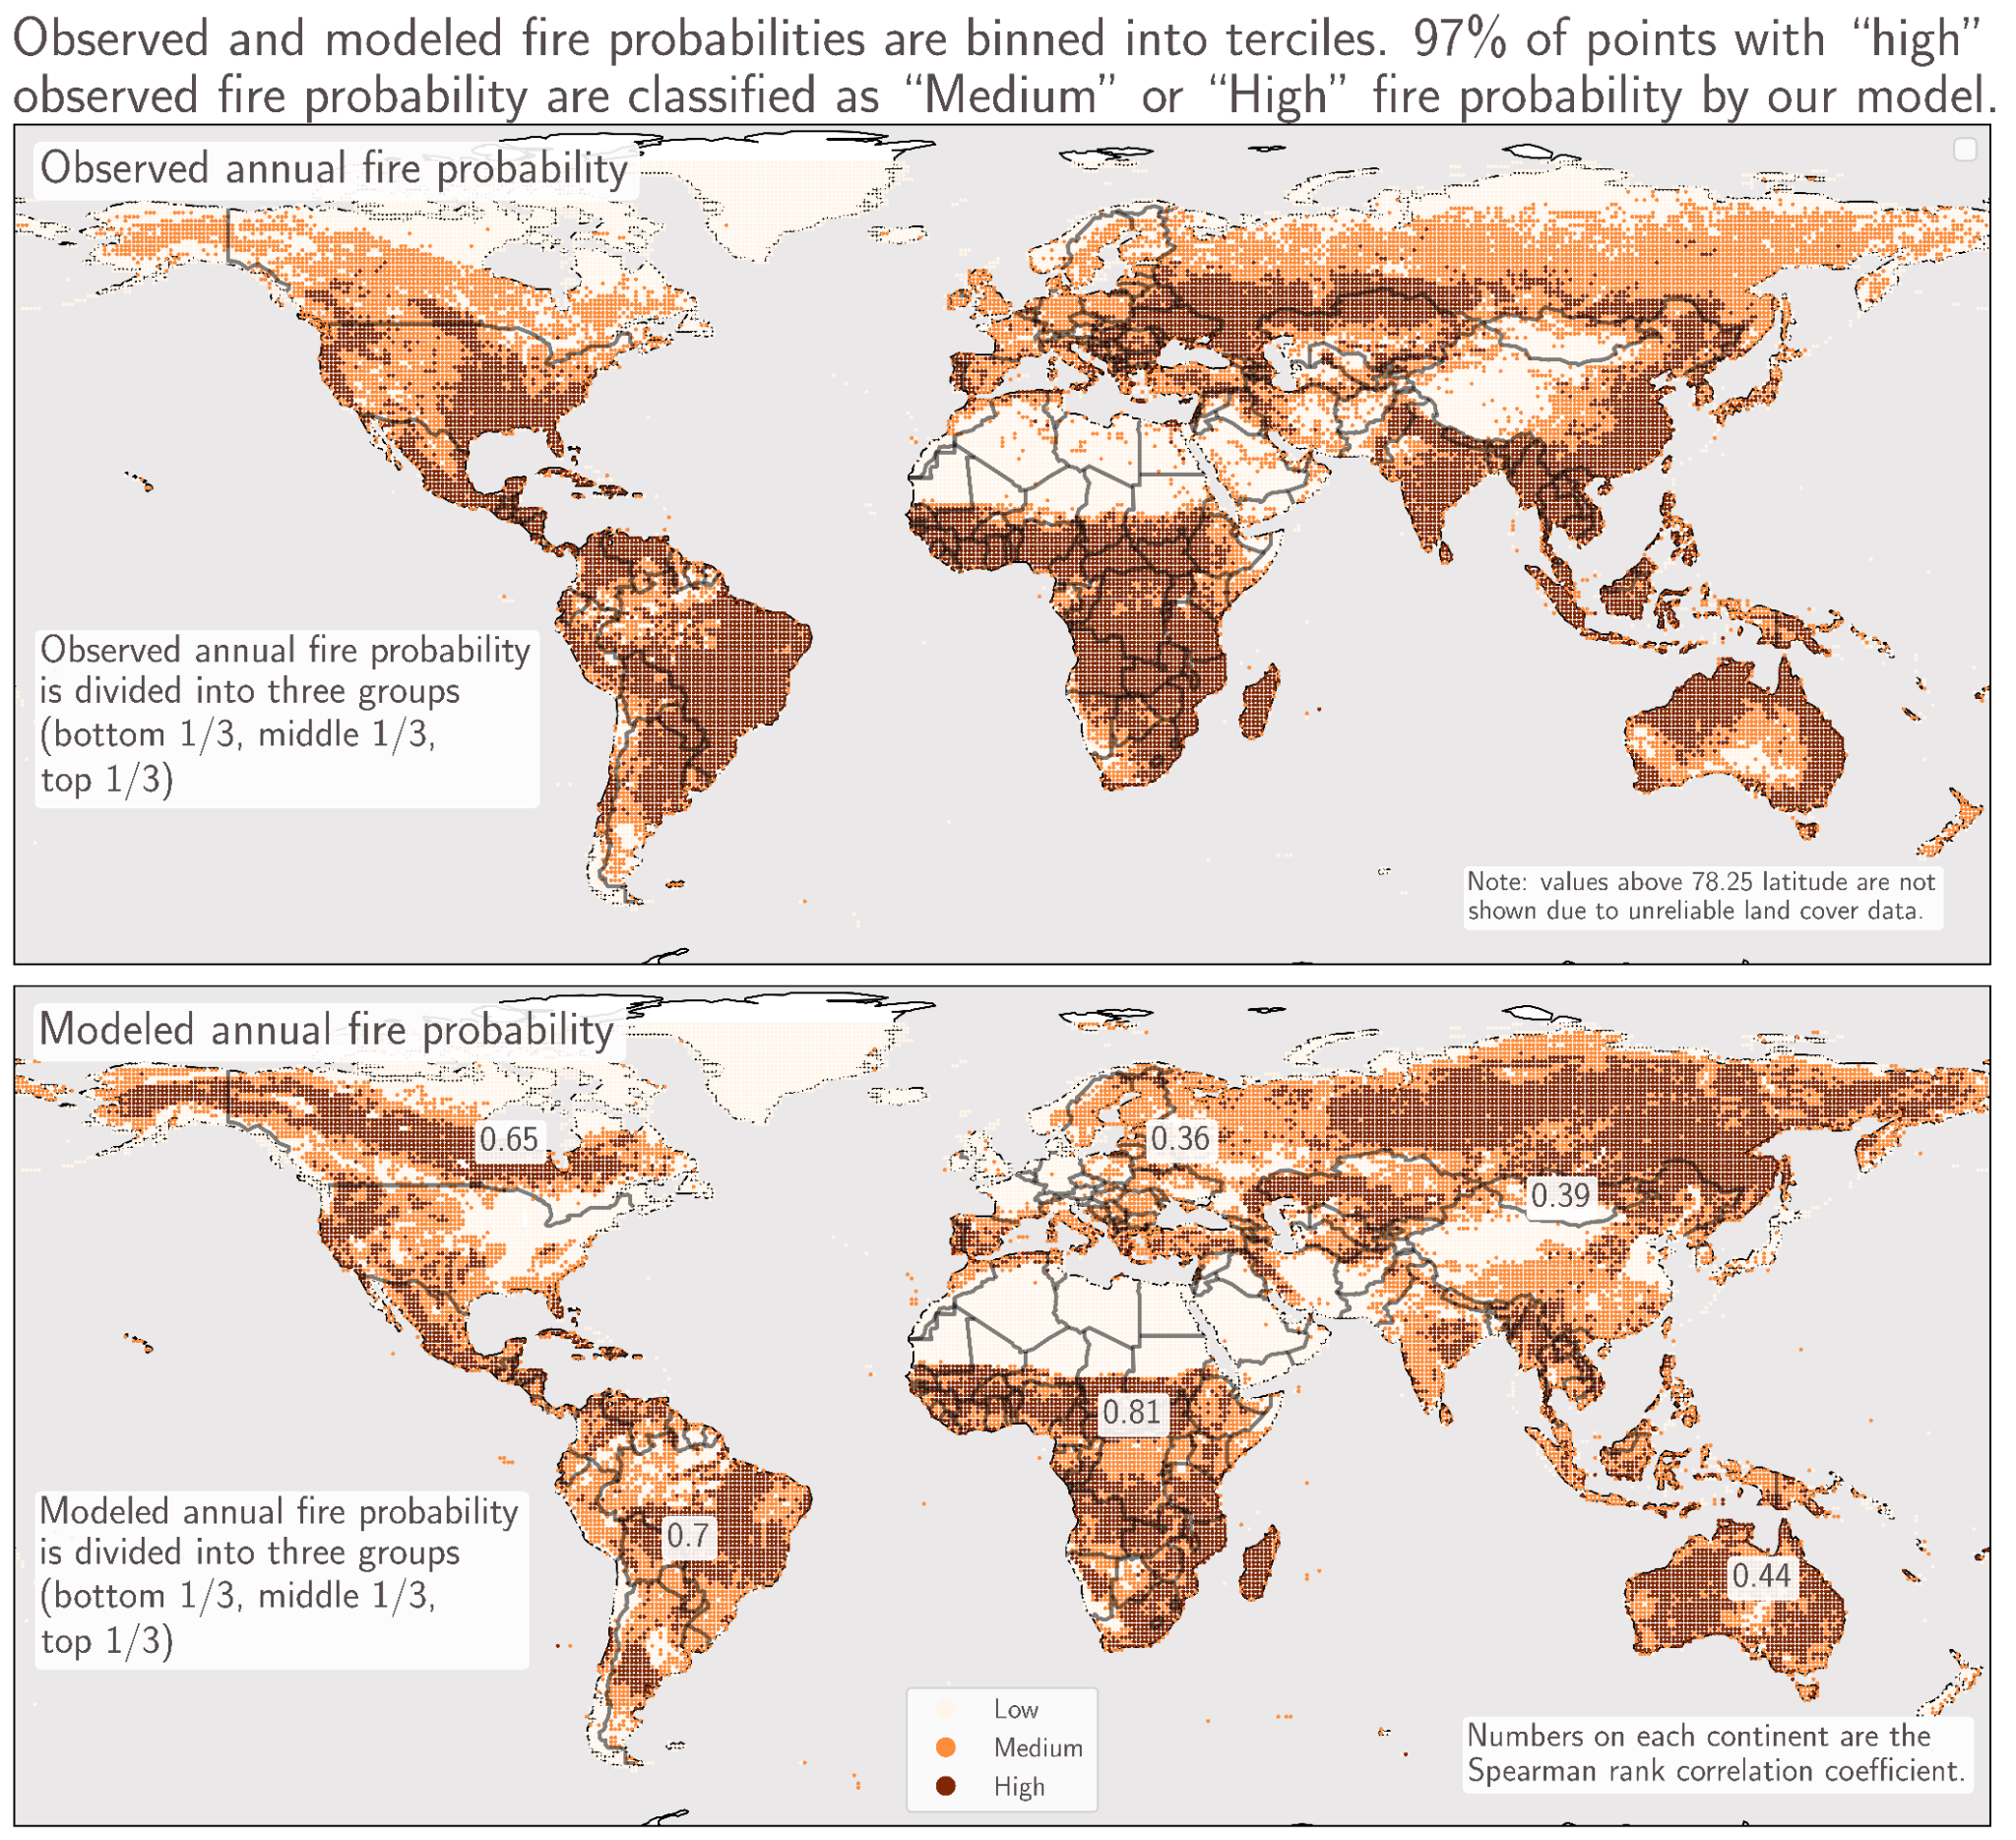
One area of disagreement between Jupiter’s model and GFED4 is in the eastern U.S. In GFED4, much of the eastern U.S. has a medium-to-high wildfire risk, while in our model, much of this area is classified as low risk. This discrepancy is likely due to how GFED4’s wildfire probability is computed. While Jupiter’s model is predicting the average annual wildfire probability for each location, GFED4 provides an estimate of the historical wildfire probability for that location. For each grid cell in GFED4, if a wildfire is detected in any month of the year, that grid cell receives an annual fire probability of 1 for that year, regardless of how many months the fire was present. Thus, the small grass fires and prescribed burns that are common in areas like the eastern U.S. are likely inflating the wildfire probability in GFED4.
The area with the largest discrepancy is the northern boreal forest areas in Alaska, Canada, Scandinavia, and Siberia. These areas generally have higher fire risk in Jupiter’s model than they do in GFED4. This is an example of the advantages of forward-looking climate data. GFED4 tells us only what has burned over its 20-year sample period, while Jupiter’s model estimates an annual wildfire risk. Indeed, studies have suggested that satellite data has underestimated the burned area in regions north of 60°N due to factors such as increased cloud cover and snow that can hide burn scars for much of the year40. GFED4 and other remote sensing datasets also tend to develop metrics in lower-latitude ecosystems that may not accurately represent the boreal forest41, which contains different vegetation, land surfaces, and background climate than tropical or temperate forests.
Potential underestimations in wildfire risk in boreal forests could be consequential. In North America, the area burned by boreal wildfires has more than doubled since the 1970s42; and fires in Siberia have also gotten larger since 201043. Many GCMs also under-represent and underestimate fire risk in high-latitude regions44. A forward-looking wildfire risk assessment helps governments, organizations, and communities prepare for future fire risk, even in locations where fires have historically been less common.
The Human Element: What Models Can and Can’t Capture
Finally, it’s important to note that there is a uniquely human element to wildfire risk. Although wildfire risk is changing and evolving over time, a catastrophic wildfire event still requires an ignition. While some wildfires are ignited by lightning, the majority are ignited by human activity. In the U.S., about 84% of wildfires are started by humans45, while in Europe, humans are responsible for over 90% of fires46. Furthermore, many wildfires are started deliberately, either as targeted prescribed burns intended for forest management or wildfire hazard reduction; or as part of slash and burn agricultural practices that use fire to quickly clear large areas of land. Slash and burn agriculture is particularly common in tropical areas such as the Amazon and sub-Saharan Africa.
We can use weather and climate data to measure the change in environmental wildfire risk. Some human elements, such as infrastructure and the spread of residential construction into the wildland-urban interface, can be modeled more easily. But other, more behavioral aspects such as not extinguishing a campfire, or deciding when and where to conduct a prescribed burn, are more difficult to quantify. New modeling efforts strive to better incorporate the human behavior elements of wildfire risk47. But for the time being, we must interpret wildfire risk in the context of human behavior in a more qualitative sense.
Wildfire risk is evolving faster than historical records can track — spreading into new geographies, intensifying in familiar ones, and compounding with smoke, water contamination, and infrastructure damage in ways that stretch well beyond the burn perimeter. The Jupiter wildfire model is built to see ahead of that curve: validated against real-world fires it was never trained on, calibrated to distinguish genuine risk from the noise of small burns and prescribed fires, and designed to surface emerging threat in places like the boreal north, where the historical record is quiet, but the trajectory is not.
For risk professionals, that means wildfire exposure assessments grounded in what the climate is becoming, not just what it has been — and confidence that the model has been tested against the world as it actually unfolded.
This is the second article in Jupiter's V&V series. Next, we turn to two of the most consequential and complex perils in the physical risk landscape: wind and flood. Like wildfire, both carry risks that historical records systematically underrepresent, and both demand the same rigor of out-of-sample validation, forward-looking calibration, and honest accounting of what models can and cannot yet capture.
References
- Jones, M.W., et. al., 2022: Global and Regional Trends and Drivers of Fire Under Climate Change. Rev. Geophys., 60, e2020RG000726.
- Parks, S.A., and J.T. Abatzoglou, 2020: Warmer and Drier Fire Seasons Contribute to Increases in Area Burned at High Severity in Western US Forests From 1985 to 2017. Geophys. Res. Lett., 47, e2020GL089858.
- Balch, J.K., et. al., 2024: The fastest-growing and most destructive fires in the US (2001 to 2020). Science, 386, 425-431.
- Jain, P., X. Wang, and M.D. Flannigan, 2017: Trend analysis of fire season length and extreme fire weather in North America between 1979 and 2015. Int. J. Wildland Fire, 26, 1009-1020.
- Simpson, I.R., et. al., 2023: Observed humidity trends in dry regions contradict climate models. Proc. Nat. Acad. Sci., 121, e2302480120.
- Abatzoglou, J.T., A.P. Williams, and R. Barbero, 2019: Global Emergence of Anthropogenic Climate Change in Fire Weather Indices. Geophys. Res. Lett., 46, 326-336.
- Herold, N., et. al., 2021: Projected changes in the frequency of climate extremes over southeast Australia. Environ. Res. Commun., 3, 011001.
- Fargeron, H., et. al., 2020: Projections of fire danger under climate change over France: where do the greatest uncertainties lie? Climatic Change,
- (PDF) 5th National Climate Assessment (NCA5) Chapter 7: Forests
- European Environment Agency, 2025: Wildfires in a warming world. Climate Preparedness 2025. Accessed 10 April 2026.
- Flannigan, M., et. al., 2013: Global wildland fire season severity in the 21st century. Forest Ecology and Management, 294, 54 - 61.
- United Nations Office for Disaster Risk Reduction, 2025: Global Assessment Report on Disaster Risk Reduction 2025: Resilience Pays: Financing and Investing for our Future. Geneva.
- European Environment Agency, 2025: Wildfires in Europe. Climate Preparedness 2025.
- Climate Central, 2026: U.S. Billion-Dollar Weather and Climate Disasters (2026). Accessed 10 April 2026.
- Heorld, N., et. al., 2021: Projected changes in the frequency of climate extremes over southeast Australia. Environ. Res. Commun., 3, 011001.
- Wang, D., et al., 2021: Economic footprint of California wildfires in 2018. Nature Sustainability, 4, 252 - 260.
- Vincent, R., 24 Jan. 2025: Estimated cost of fire damage balloons to more than $250 billion. Los Angeles Times.
- Cascio, W., 2017: Wildland fire smoke and human health. Sci. Total. Env., 624, 586 - 595.
- Clarke, H., et. al., 2023: Health costs of wildfire smoke to rise under climate change. npj Climate and Atmospheric Science, 6, 102.
- Lancet Countdown, 2025: 2025 Global Report. Accessed 10 April 2026.
- Ford, B., et. al., 2018: Future Fire Impacts on Smoke Concentrations, Visibility, and Health in the Contiguous United States. GeoHealth, 2, 229 - 247.
- Qiu, M., et. al., 2025: Wildfire smoke exposure and mortality burden in the USA under climate change. Nature, 647, 935 - 943.
- Zhang, M., et. al., 2026: Wildfire smoke PM2.5 and mortality rate in the contiguous United States: A causal modeling study. Sci. Advances, 12, 5890.
- Brey, S.J., et. al., 2018: Connecting smoke plumes to sources using Hazard Mapping System (HMS) smoke and fire location data over North America. Atmos. Chem. Phys., 18, 1745 - 1761.
- Boaggio, K., et. al., 2022: Beyond Particulate Matter Mass: Heightened Levels of Lead and Other Pollutants Associated with Destructive Fire Events in California. Environ. Sci. Tech., 56, 14272 - 14283.
- Los Angeles Regional Fire Safe Council, 27 Mar. 2026: What Lies Beneath: Soil Contamination Concerns Grow in Pacific Palisades, Malibu, and Altadena. Wildfire Los Angeles. Accessed 18 April 2026.
- Rao, J.N., and T. Parsai, 2025: Pollution and toxicity of heavy metals in wildfires-affected soil and surface water: A review and meta-analysis. Environ. Pollution, 369, 125845.
- Proctor, C.R., et. al., 2020: Wildfire caused widespread drinking water distribution network contamination. AWWA Water Science, 2, e1183.
- Smith, H.G., et. al., 2011: Wildfire effects on water quality in forest catchments: A review with implications for water supply. J. Hydrology, 396, 170 - 192.
- Hersbach, H., et. al., 2020: The ERA5 global reanalysis. Quart. J. Roy. Meteorol. Soc., 146, 1999 - 2049.
- IPCC, 2023: Climate Change 2023: Synthesis Report. Contribution of Working Groups I, II and III to the Sixth Assessment Report of the Intergovernmental Panel on Climate Change [Core Writing Team, H. Lee and J. Romero (eds.)]. IPCC, Geneva, Switzerland, pp. 35-115, doi:10.59327/IPCC/AR6-9789291691647.
- Marcel Buchhorn, Bruno Smets, Luc Bertels, Myroslava Lesiv, Nandin-Erdene Tsendbazar, Martin Herold, and Stephen Fritz. Copernicus global land service: Land cover 100m: collection 2: epoch 2015: Globe, October 2019.
- Randerson, J.T., G.R. van der Werf, L. Giglio, G.J. Collatz, and P.S. Kasibhatla, 2018. Global Fire Emissions Database, Version 4, (GFEDv4). ORNL DAAC, Oak Ridge, Tennessee, USA. https://doi.org/10.3334/ORNLDAAC/1293
- Short, K.C., et. al. 2020: Spatial datasets of probabilistic wildfire risk components for the United States (270m) (2nd edition). Title of the publication associated with this dataset: Forest Service Research Data Archive.
- Schug, F., et. al., 2023: The global wildland–urban interface. Nature, 621, 94 - 99.
- Tang, W., C. He, L. Emmons, and J. Zhang, 2024: Global expansion of wildland-urban interface (WUI) and WUI fires: insights from a multiyear worldwide unified database (WUWUI). Environ. Res. Lett., 19, 044028.
- Radeloff, V.C., et. al., 2023: Rising wildfire risk to houses in the United States, especially in grasslands and shrublands. Science, 382, 702 - 707.
- Ward, D.S., et. al., 206: Variability of fire emissions on interannual to multi-decadal timescales in two Earth System models. Environ. Res. Lett., 11, 125008.
- U.S. Geological Survey, USDA Forest Service, and Nelson, K., 2021, Monitoring Trends in Burn Severity (ver. 12.0, April 2025): U.S. Geological Survey data release, https://doi.org/10.5066/P9IED7RZ.
- EFFIS team (2026). Fire Database in the European Forest Fire Information System (version 2-3-1). European Commission, Joint Research Centre. doi: 10.2905/JRC.KCNZPQ0.
- Chen, D., V. Shevade, A. Baer, and T.V. Loboda, 2021: Missing Burns in the High Northern Latitudes: The Case for Regionally Focused Burned Area Products. Remote Sensing, 13, 4145.
- Eckdahl, J.A., L. Nieradzik, and L. Rütting, 2026: Reassessing boreal wildfire drivers enables high-resolution mapping of emissions for climate adaptation. Sci. Advances, 12, 5226.
- Lakhanti, H., et. al., 2018: Northern High-Latitude Wildfires and Climate Change. Woodwell Climate Research Center. Accessed 9 April 2026.
- Conard, S.G., and E. Ponomarev: Fire in the North: The 2020 Siberian Fire Season. International Association of Wildland Fire. Accessed 9 April 2026.
- Schädel, C., et. al., 2026: Permafrost and wildfire carbon emissions indicate need for additional action to keep Paris Agreement temperature goals within reach. Communications Earth & Environment, 7, 306.
- Balch, J.K., et. al., 2017: Human-started wildfires expand the fire niche across the United States. Proc. Nat. Acad. Sciences, 114, 2946 - 2951.
- Dijkstra, J., et. al., 2022: Anthropogenic and Lightning Fire Incidence and Burned Area in Europe. Land, 11, 651.
- Perkins, O., et. al., 2025: The Spatial Distribution and Temporal Drivers of Changing Global Fire Regimes: A Coupled Socio‐Ecological Modeling Approach. Earth’s Future, 13, e2024EF004770.
