.webp)
[EXTREME WEATHER]
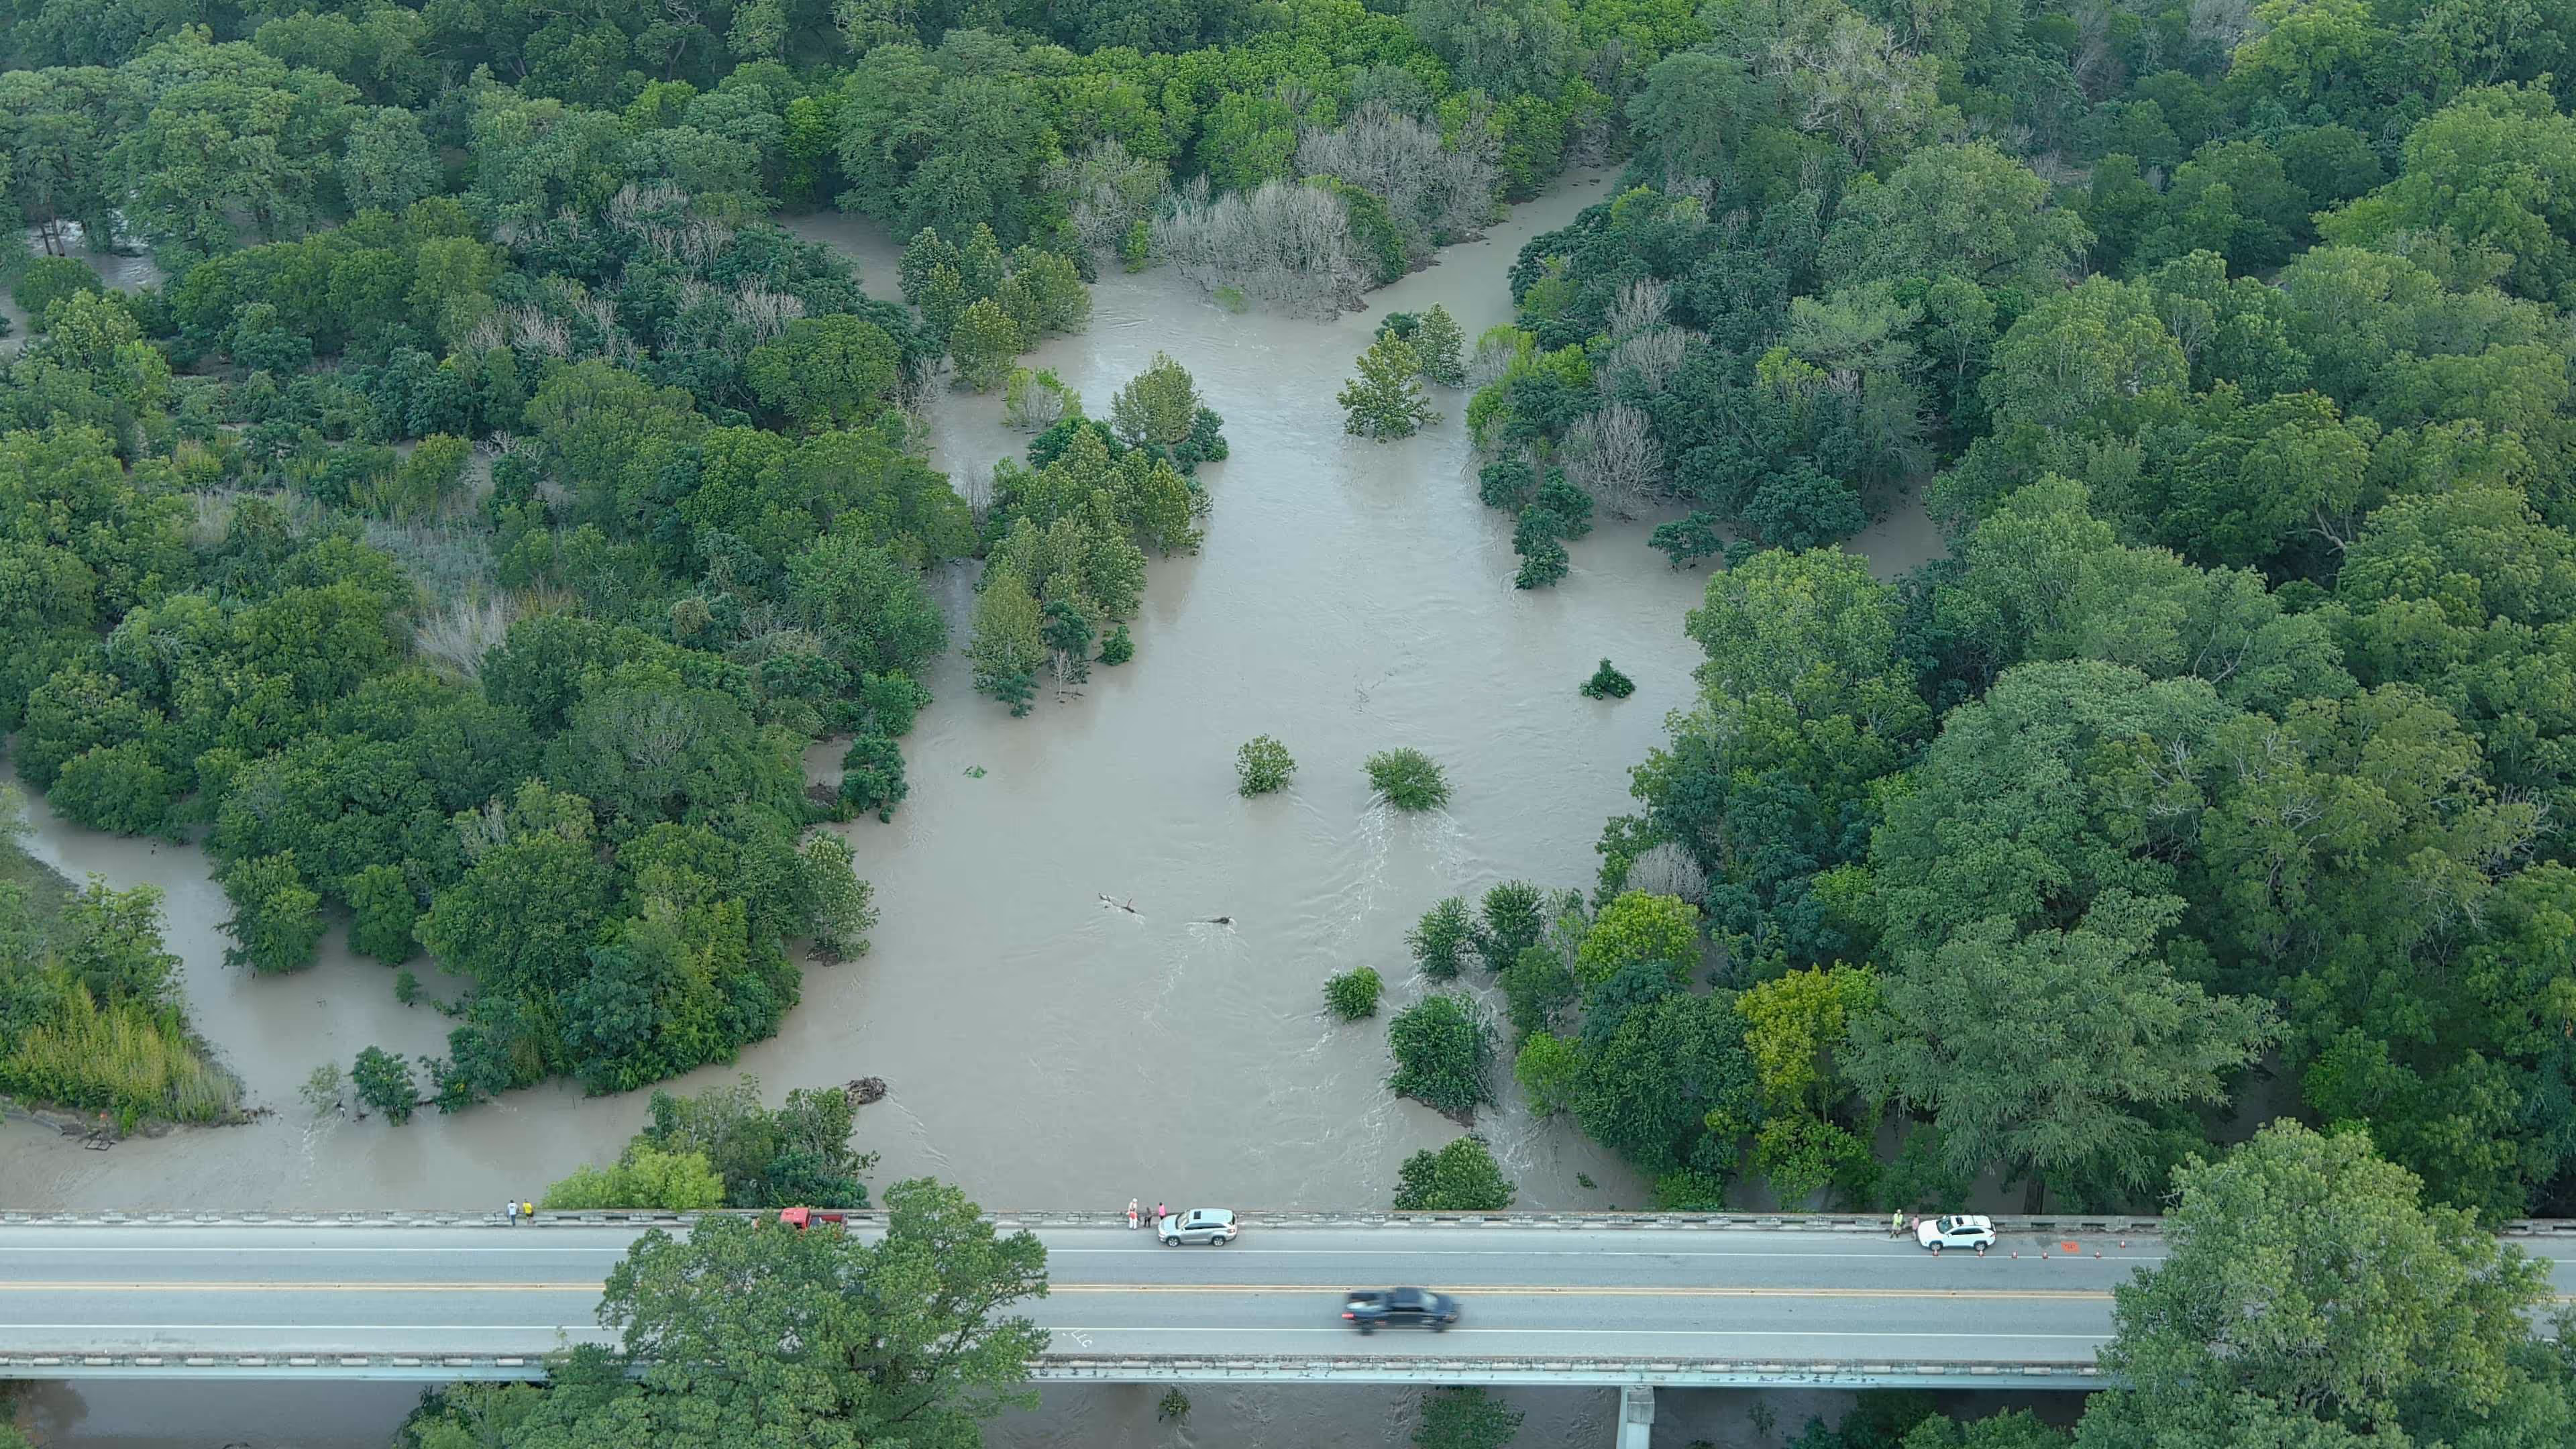
Over the July 4th weekend, deadly flash floods swept through Texas Hill Country, turning riverside campsites into disaster zones. With over 130 confirmed deaths and more than 100 people still missing, it is now the deadliest flash flooding event in the U.S. since 1976.
But while the devastation is undeniable, so is the signal. This was not a random outlier. The July 4 flood fits a growing pattern of more intense, more localized, and more frequent extreme precipitation events. That’s especially dangerous in geographies like central Texas, where topography and soil composition make flash floods both more likely and more deadly.
A Week of Rain, Then a Night of Catastrophe
The days leading up to the disaster were already wet. What remained of Tropical Storm Barry stalled over Texas, feeding warm, moisture-rich air into the region. The result was a rain-soaked landscape primed for flooding.
Then came the July 4 downpour.
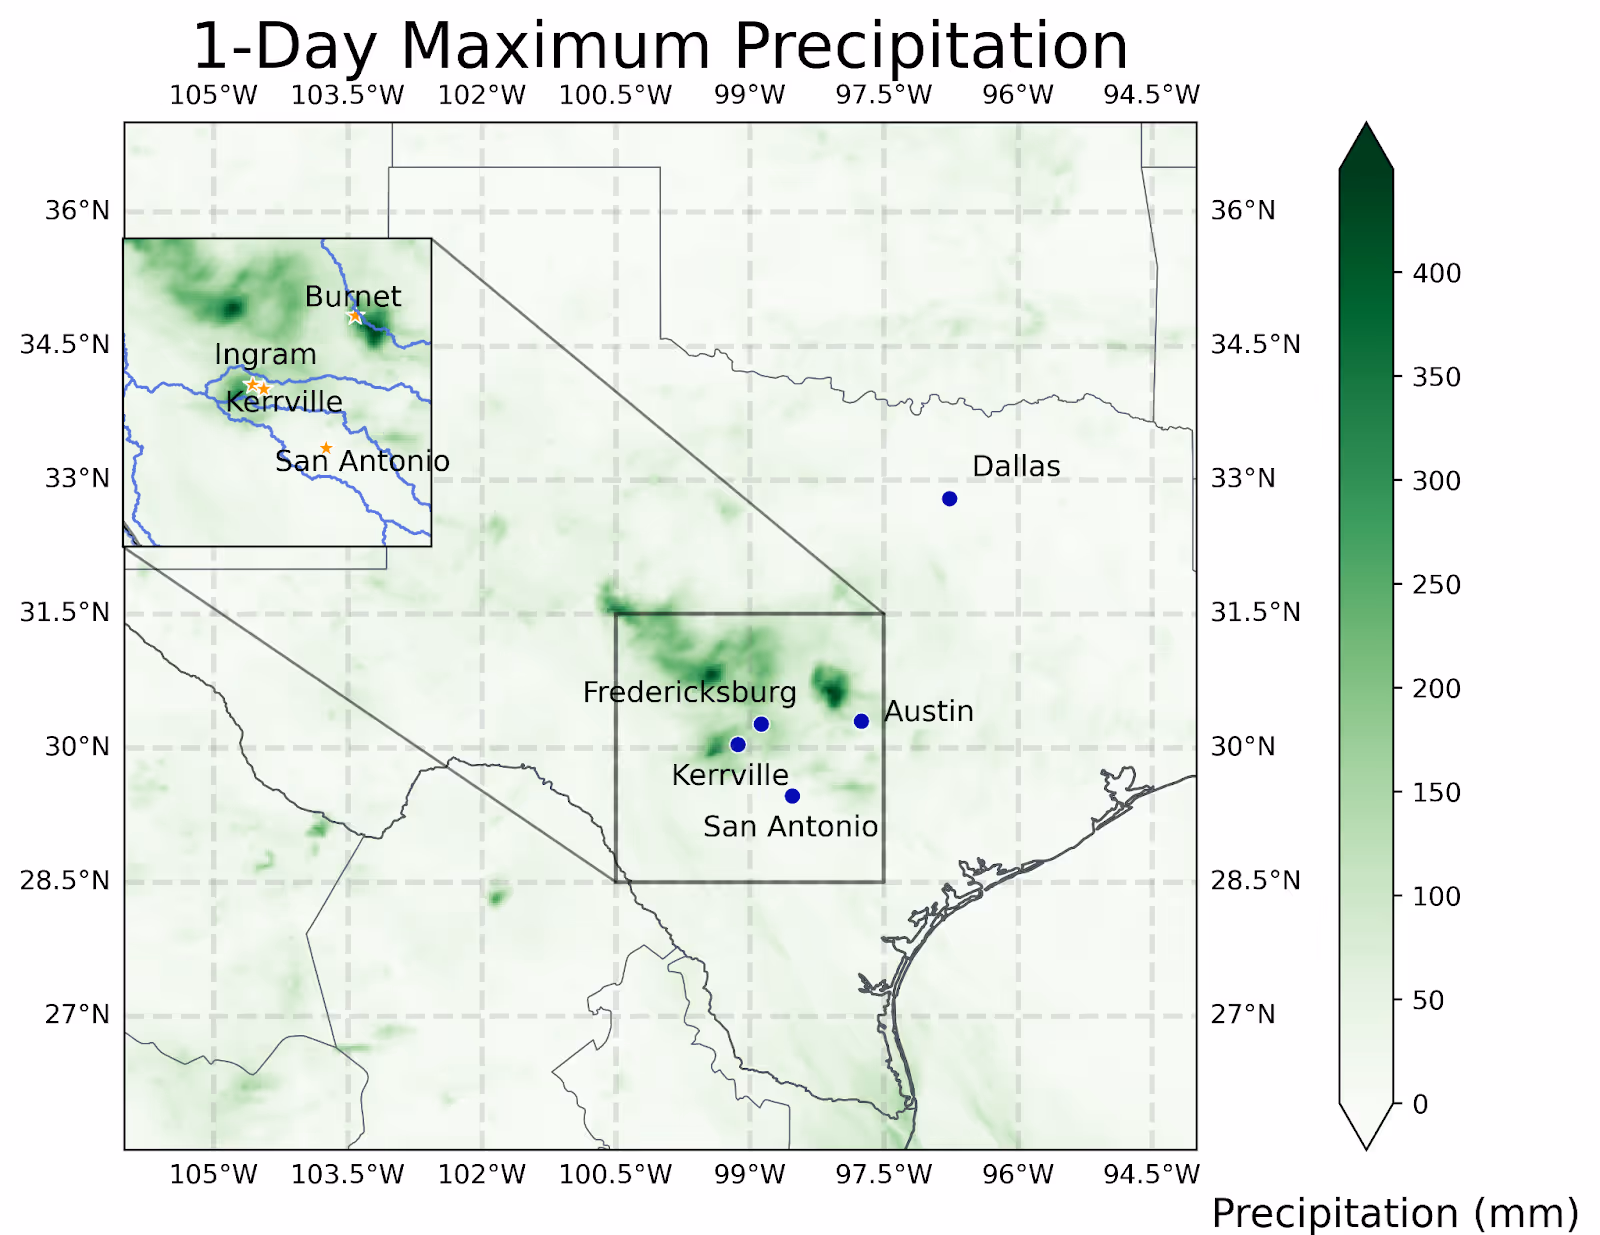
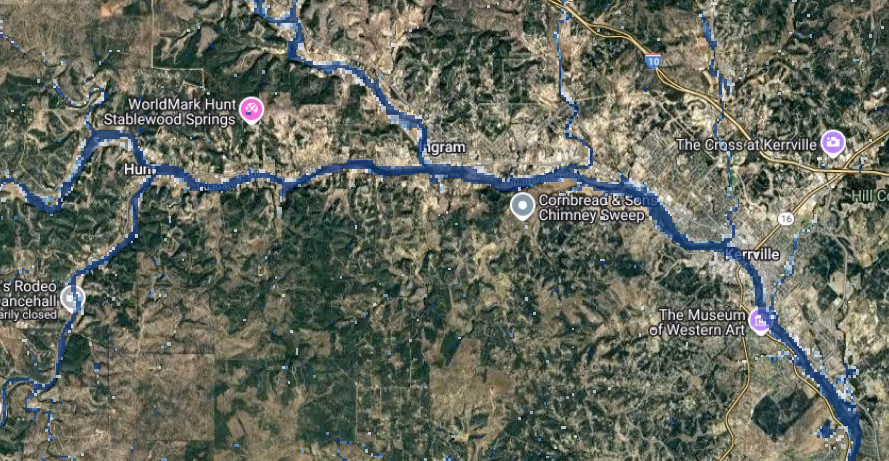
Overnight, some areas received more than 11 inches (300 mm) of rain in just a few hours. The Guadalupe River rose 20 feet in 3 hours, sweeping through Ingram, Kerrville, and nearby towns at terrifying speed. Campers and holiday visitors had little time to react – and even less visibility – when the river surged in the middle of the night, making escape more difficult and dangerous.
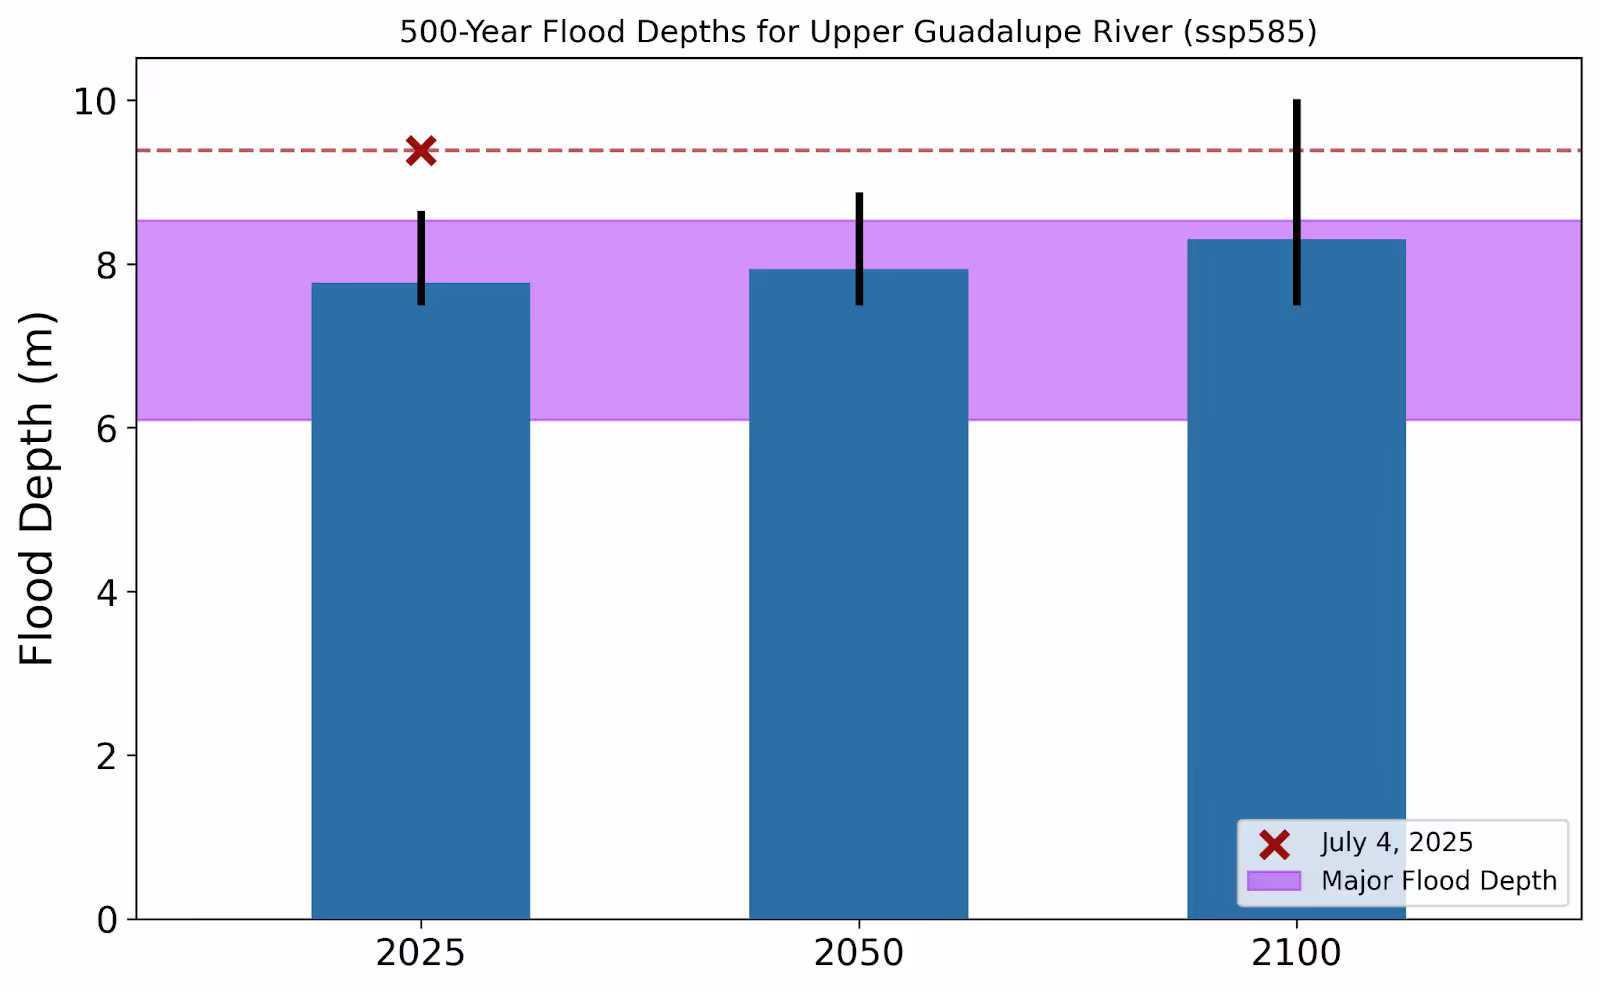
The loss of life was staggering. So was the scale of the hydrological extremes. Jupiter’s flood model identified major flooding along the Guadalupe River, with modeled depths exceeding 30 feet (9.65 m) in some areas. That’s well above the 6-7 meter threshold for “major flooding” according to NOAA.
Why This Flood Matters
What makes this event so alarming isn’t the death toll alone. It’s also what it tells us about flood risk in a warming world.
- Total annual rainfall isn’t the issue. Central Texas isn’t projected to get significantly wetter overall in an average year. However, when it rains, it will rain harder and more intensely. ClimateScore Global projects that 100-year rainfall events in this region will contain 10% more rain by 2050, and up to 30% more by 2100.
- Short-duration rainfall is key. Flash floods depend on intense bursts of rainfall. This event exemplifies that danger. Localized downpours overwhelmed the region’s rivers, whose steep limestone beds don’t absorb water well. Analyzing flash flooding requires accounting for how short-duration rainfall, local geography, and soil saturation interact – recognizing that forward-looking analytics like ClimateScore Global help assess long-term exposure trends, while near-term flood prediction may require supplemental data and models.
- Topography makes it worse. The Texas Hill Country’s steep slopes and impermeable terrain funnel water rapidly into rivers. That intensifies flash floods. The same geography that draws tourists makes it uniquely dangerous during extreme weather.
- Observed flooding exceeded ClimateScore Global’s 95th percentile estimates. Projections showed a 95th percentile 500-year flood depth of 8.65 meters for the area around Ingram. The post-event model showed flood depths near 9.4 meters, well above that threshold. This doesn’t mean the model failed. It means that even our most extreme scenarios are now coming to pass.
ClimateScore Global in Action
ClimateScore Global, Jupiter’s flagship physical climate risk analytics platform, projects localized risk from climate hazards – including flooding – out to the year 2100 under various emissions scenarios. It provides 95th percentile estimates for metrics like flood depth, helping customers understand what worst-case events might look like.
For this event:
- ClimateScore Global’s flood depth projections aligned with the right locations of extreme risk: Kerrville, Ingram, and the Guadalupe River corridor.
- The magnitude of the event slightly exceeded 2025’s upper-bound estimates, but falls within the range projected for 2100.
- The rate of increase is accelerating. While mean flood depths are rising, upper extremes are rising even faster. This underscores the need to plan for tail-risk scenarios, not just averages.
What This Means for Risk Professionals
This flood was not unpredictable. It was prefigured in both physical geography and climate projections. But it highlights a growing problem. Traditional flood maps and risk models often fail to capture flash flood dynamics, especially in regions where the difference between safety and disaster can be a matter of inches and minutes.
Risk and ESG professionals need to:
- Shift focus from average conditions to extreme event probability and magnitude
- Account for how short-duration rainfall (from supplemental data sources), local geography, and soil saturation interact
- Use forward-looking analytics like ClimateScore Global to update risk exposure assumptions
Science You Can Act On
Climate change doesn’t just shift averages. It warps the extremes. That’s what makes events like the July 2025 Texas floods so dangerous – and so cautionary.
With the upper limits of extreme flood depth rising faster than the mean, resilience planning must account for outliers that no longer are. That’s exactly what ClimateScore Global is designed to help with – understanding where, how, and how much climate-driven risk is evolving, so organizations can prepare before the next record is broken.
To learn how companies are using Jupiter to inform resilience, risk underwriting, and regulatory reporting, contact us at info@jupiterintel.com or request a demo.
References
- Nielsen, Erik R., Russ S. Schumacher, and Alexandra M. Keclik. "The effect of the Balcones Escarpment on three cases of extreme precipitation in central Texas." Monthly Weather Review 144.1 (2016): 119-138.
- Lanza, M. (2025, July 5). Making sense of the weather that led to a horrible Texas flooding tragedy, plus Tropical Storm Chantal. The Eyewall
- NOAA National Water Prediction Service
