.webp)
A Deep Dive Into Peril Metrics
What Climate Science and Physical Risk Data Can Reveal About Your Vulnerability to Climate Change—and How to Improve Resilien
The urgent need to comply with new, climate-oriented directives from the EU Taxonomy under the European Green New Deal has spurred large companies within the European Union to hunt for ways to quantify physical risk exposure to acute and chronic perils driven by climate change.
The request may seem daunting, but there’s good news: best-in-science data and models do exist—now—to help you do that for the majority of the perils the Taxonomy has enumerated. What’s more, physical climate risk data can play a vital role beyond disclosure reporting as ongoing tools for risk management and business resiliency activities that can make your firm more operationally and financially sound.
As the global leader in physical climate risk modeling, Jupiter has created three, brief informational webcasts in the runup to its first major EU Taxonomy reporting deadline this December 31st. This is a companion blog to the third video in this series, where I explore the physical climate risk metrics that can help you comply with the Taxonomy, and explain how they can reveal the story that your climate data is telling you.
What Today’s Data Can Show
The EU Taxonomy is a classification system and common language designed to give investors guidance on identifying sustainable investments in companies and sectors that support the EU’s environmental objectives.
Unlike other frameworks with deliberately vague physical climate risk reporting requirements, such as those from the TCFD (Task force on Climate-related Financial Disclosures), the EU Taxonomy is specific. It seeks risk assessment for 33 acute and chronic perils across four categories. However, for a few of these, a gap exists between what the Taxonomy demands and the scientific community’s current understanding about how—or whether—those perils can be reliably measured or understood based on the data we have today.
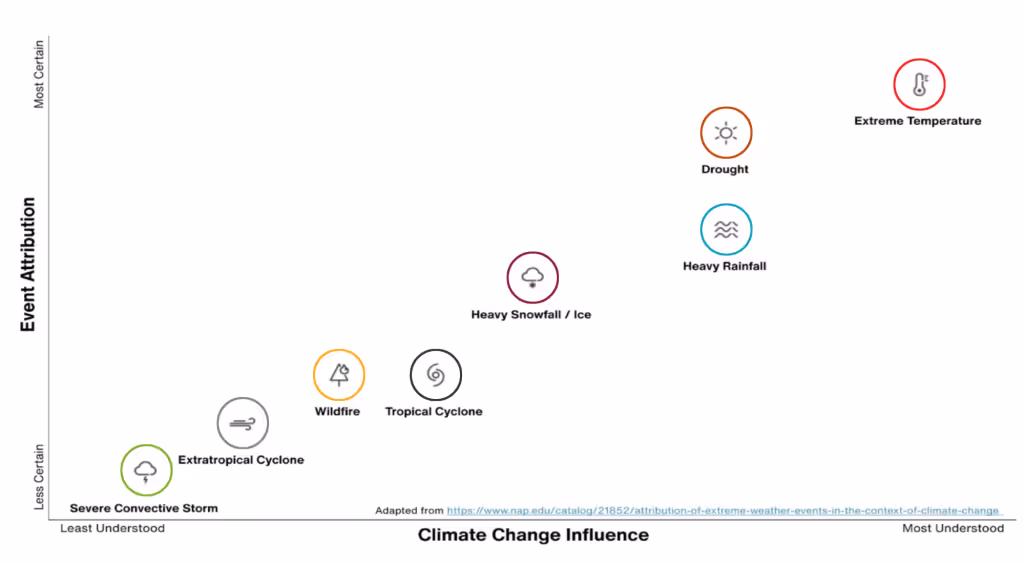
Generally speaking, chronic events are easier to reliably model than acute ones, because more data have been collected on them. In addition, the more straightforward a peril’s underlying physical mechanisms are, the more readily climate change’s impacts on it can be modeled. For example (Figure 1), perils caused by rising temperatures like extreme heat, drought, and heavy rainfall are well understood.
It’s harder to label a specific tropical cyclone as a true indicator of climate change, because tropical cyclones occur less frequently, so scientists need years of data to discern patterns. Consensus has only recently emerged that these events will bring more rainfall in the future, but the jury’s still out on storm tracks and frequencies, and the research is so new it’s not yet in the most recent set of Global Climate Models, CMIP6. The extreme left bottom of the graph reflects that there’s little consensus today about how climate change affects some rare events, like severe convective storms (i.e., tornadoes), that have complex and often conflicting driving factors.
Lack of scientific understanding is not the sole reason for the gap between what the Taxonomy requires, and what’s possible to quantify. Some perils (like coastal erosion) demand highly localized analysis that is generally out of reach for large, globally distributed companies, and others (e.g., soil degradation) are driven by human policies or processes.
Applying Best-in-Science Metrics to Most Relevant Perils
So, how do you harness climate data to work through the EU Taxonomy?
First, Jupiter encourages you to identify, and focus on, the most relevant hazards to your business. For example, a white-collar firm is much less affected by a drought than an agribusiness, manufacturer, or a mine operator. Second, engage the climate data provider with the most appropriate menu of available, best-in-science metrics for your set of hazards.
Jupiter, for example, directly models 16 of the EU Taxonomy’s 33 enumerated perils (Figure 2). For ten more, we provide complementary metrics that are expected to change in the same way the requested peril will change—like extreme rainfall leading to landslides. For the seven perils that are not yet sufficiently understood, we offer detailed information on the state of the science.

Jupiter Intelligence is uniquely suited to helping companies address the EU Taxonomy’s requirements for climate vulnerability assessments and reporting for four main reasons:
- Our analysis is based on the most thorough, state-of-the-art climate models, and provides the most reliable and scientifically sound projections.
- Our flagship product, ClimateScore Global, covers the majority of the Taxonomy’s required hazards at 90-meter (portfolio-scale) resolution; it also enables users to project potential impacts until 2100 in five-year increments, and across three different climate change scenarios, allowing companies to match the metric, scenario, and time horizon to their assets’ critical vulnerabilities and remaining useful life
- Its unique combination of aggregated hazard scores and 75 detailed peril metrics allows for an easy identification of portfolio-wide risk and in-depth assessment of expected impacts.
- Jupiter partners with some of the world’s biggest consultancies and auditors, to provide a full range of services for sustainability reporting if needed.
Jupiter: Supporting Your Climate Resiliency Journey
Some companies may grudgingly confront their massive climate-risk challenge only because a regulator’s gun is at their backs. But, for many of you, compulsory disclosure under the EU Taxonomy is part of a business-critical climate journey. If you’re concerned that climate risk will affect your operations, supply chains, and balance sheets, you need to know how, and plan mitigation measures. Ultimately, you’ll want to integrate climate data into ERM processes and other decision-making tools.
That demands a closer partnership with a climate data provider—like Jupiter—that can help you analyze specific assets, model supply chain risk, and develop custom metrics and dashboards. I urge that you watch (or rewatch) our webcast series, and visit the EU Taxonomy hub on our website. You can talk to a Jupiter expert about how to use our data and services for regulatory disclosure, risk management, and resiliency activities, see ClimateScore Global in action, and download a use case/overview.
A journey that begins with immediate compliance needs can lead to long-term sustainability and success.
